Stellar (XLM) is trading at around $0.155 USD at the time of writing on Wednesday, after a slight rebound from the previous day. Although an upward trend is forming, mixed signals from on-chain data and derivatives markets indicate that trader sentiment remains cautious, reflecting investors’ hesitation toward XLM. From a technical perspective, the bullish outlook could be strengthened if XLM successfully breaks above the current downtrend, opening the possibility for short-term gains.
Mixed On-Chain and Derivatives Data Show Hesitation
Stellar’s on-chain data initially signals positive signs. According to Santiment analytics platform, the Social Dominance index—measuring the proportion of discussions related to XLM across crypto media—has steadily increased since late February, reaching 0.029% on Tuesday, the highest since February 4. This upward movement suggests growing market attention toward XLM and reflects a more optimistic investor sentiment.
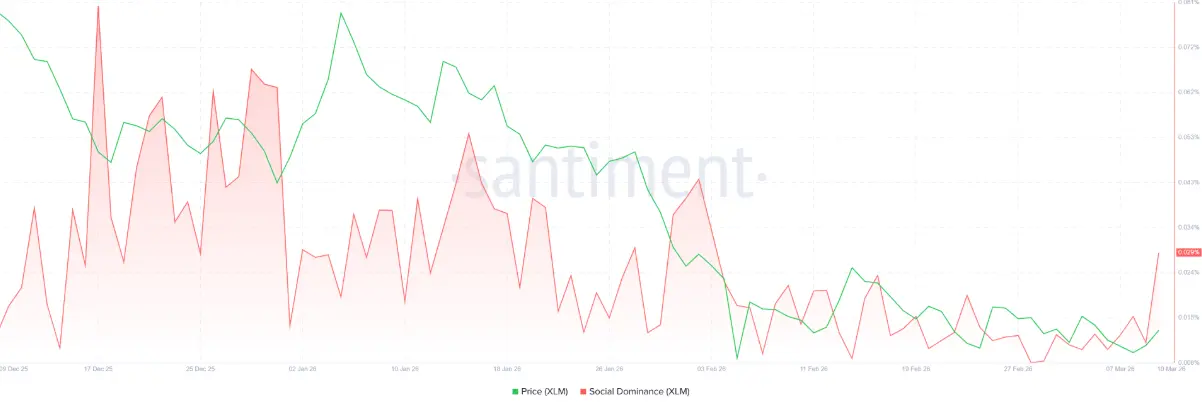 XLM Social Dominance Chart | Source: Santiment
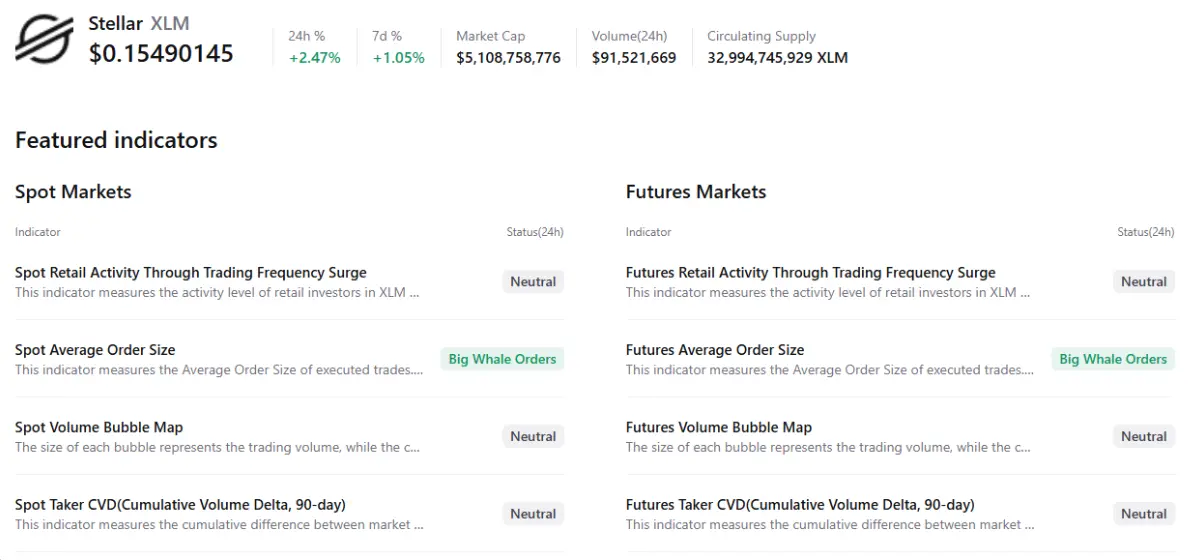
However, the overall picture remains unclear. Data from CryptoQuant indicates that the general outlook is still neutral, despite some early bullish signals. The appearance of large trades from “whale” groups offers slight positive expectations for XLM. Nonetheless, many key indicators across spot and futures markets still show caution and hesitation among traders.
XLM Social Dominance Chart | Source: Santiment
However, the overall picture remains unclear. Data from CryptoQuant indicates that the general outlook is still neutral, despite some early bullish signals. The appearance of large trades from “whale” groups offers slight positive expectations for XLM. Nonetheless, many key indicators across spot and futures markets still show caution and hesitation among traders.
In the derivatives market, signals lean toward a bearish scenario. The XLM funding rate remains negative, and the number of short positions is increasing. According to OI-Weighted Funding Rate data from CoinGlass, more traders are betting that Stellar’s price will continue to decline than those expecting an increase. This indicator has been in negative territory since Friday and stayed around -0.006% on Wednesday. This suggests short positions are paying fees to long positions—often a sign of bearish market sentiment.
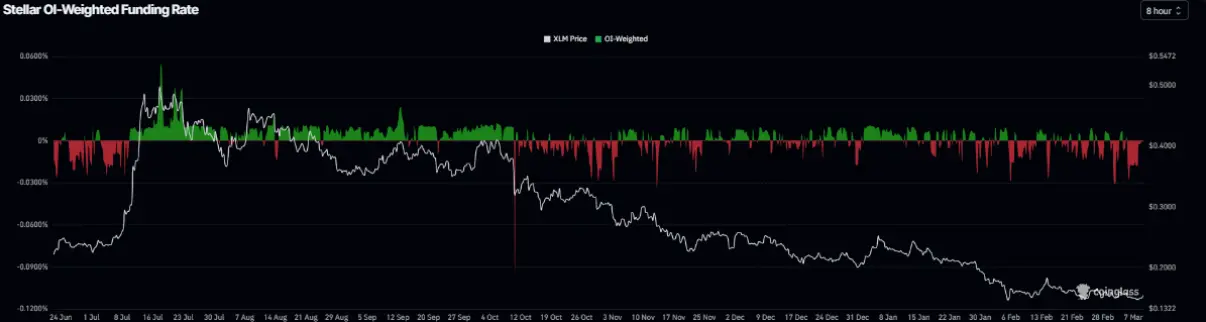 XLM Funding Rate Chart. Source: CoinGlass
Additionally, the long/short ratio for Stellar during this period is only 0.77; a figure below 1 indicates more traders are leaning toward a bearish scenario.
XLM Funding Rate Chart. Source: CoinGlass
Additionally, the long/short ratio for Stellar during this period is only 0.77; a figure below 1 indicates more traders are leaning toward a bearish scenario.
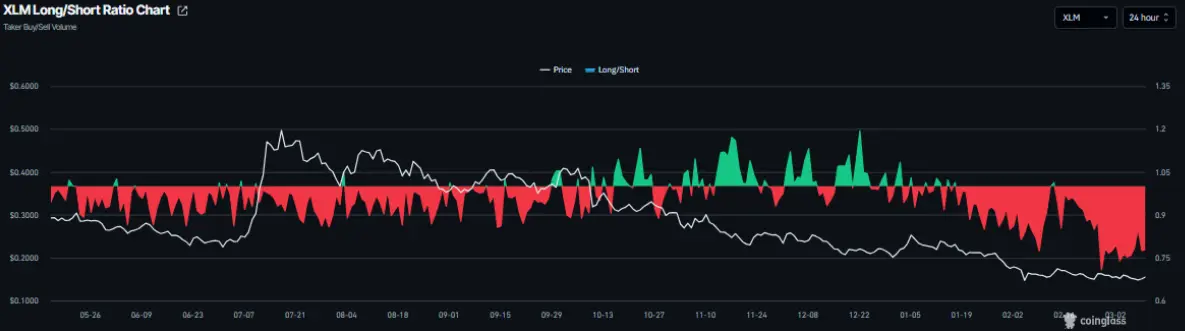 XLM Long/Short Ratio Chart | Source: CoinGlass
The divergence between somewhat positive on-chain data and bearish derivatives signals indicates market sentiment remains divided. This hesitation could hinder the sustainability of a solid recovery for XLM in the short term.
XLM Long/Short Ratio Chart | Source: CoinGlass
The divergence between somewhat positive on-chain data and bearish derivatives signals indicates market sentiment remains divided. This hesitation could hinder the sustainability of a solid recovery for XLM in the short term.
Stellar Price Forecast: XLM Could Extend Gains if It Breaks the Downtrend
Disclaimer: The information on this page may come from third parties and does not represent the views or opinions of Gate. The content displayed on this page is for reference only and does not constitute any financial, investment, or legal advice. Gate does not guarantee the accuracy or completeness of the information and shall not be liable for any losses arising from the use of this information. Virtual asset investments carry high risks and are subject to significant price volatility. You may lose all of your invested principal. Please fully understand the relevant risks and make prudent decisions based on your own financial situation and risk tolerance. For details, please refer to
Disclaimer.
Related Articles
PEPE Reclaims 0.00000400 — Is This 1.8% Move the Start of a Bigger Run?
PEPE rebounds from 0.00000385 support, forming higher lows and stronger bullish structure.
Technical indicators like MACD and RSI show momentum with room for further upside.
Key resistance at 0.00000410; support at 0.00000380 critical for trend continuation.
PepeCoin — PEPE, has
CryptoNewsLand35m ago
ETH drops 0.58% in 15 minutes: derivatives liquidity contraction and proactive position reduction dominate short-term pullback
From 2026-04-19 04:30 to 2026-04-19 04:45 (UTC), within ETH’s 15-minute candlestick chart, the return recorded -0.58%, and the price range was 2321.62 to 2342.04 USDT, with an amplitude of 0.87%. The short-term selloff occurred against a backdrop of increased overall market volatility and a broad decline in the prices of major crypto assets; overall market risk appetite clearly fell, and traders’ wait-and-see sentiment strengthened.
The main driver behind this abnormal move is a sharp contraction in liquidity in the derivatives market and leveraged funds proactively reducing positions. Data shows that over the past 24 hours, the ETH/USD perpetual contract trading volume dropped 67.16% to approximately 74.87 million, open interest edged down 3.33% to 329 million, and liquidation amounts did not expand unusually. This structure indicates that the market lacks the risk of passive cascades; more funds chose to proactively step aside and wait on the sidelines, intensifying short-term selling pressure.
In addition, the long/short structure in which shorts held the upper hand (long/short ratio 47.48%:52.52%) and sentiment synchronization with the panic range reinforced the downward price trend. During the same period, major coins such as BTC and SOL also fell 2%-3.4% in tandem, further showing that this pullback was driven by system-wide risk sentiment. On-chain funds did not show any large abnormal transfers or large-scale liquidations of DeFi protocols; spot and on-chain liquidity remained generally stable, and no sudden system risk resonance was observed.
Current volatility-related risks still need close monitoring, especially as overall risk appetite continues to contract—ETH’s short-term price may face further downside probing. Watch subsequent changes in derivatives trading volume and open interest, extreme shifts in the long/short ratio and funding rate, and promptly monitor on-chain fund flows, large transfers, and any signs of amplified platform net outflows. For more market anomalies and deeper analysis, please continue to follow our upcoming market updates.
GateNews1h ago
Spark Protocol's January delisting of rsETH proves prudent as Aave faces ETH liquidity crisis
Spark Protocol's strategy of delisting low-usage assets and tightening collateral has faced initial backlash but proved wise during market turmoil. While maintaining higher interest rate caps, SparkLend ensures liquidity, unlike Aave, which now faces significant risks.
GateNews1h ago
Request Network (REQ) Surges 23.68% in 15 Minutes, 24-Hour Gain Reaches 116.52%
Request Network (REQ) surged 23.68% in just 15 minutes, reaching $0.152, with a 24-hour rise of 116.52% and trading volume over $8 million. Factors include retail interest and whale accumulation. Resistance at $0.160 and support at $0.122 are under observation.
GateNews2h ago
Solana Price Stalls Near $80 as ETF Outflows Weigh
Solana trades around $80, facing bearish sentiment due to ETF outflows and declining retail participation. Technical indicators show mixed signals, with resistance at $87 and $98, while support at $77 remains critical for stability.
CryptoFrontNews7h ago
Dogecoin Holds $0.094 as X Cashtags Drive Market Attention
Key Insights
Dogecoin holds above $0.094 despite market weakness as Bitcoin and Ethereum stabilize, reflecting resilience and sustained demand across major cryptocurrencies during the consolidation phase.
X launches smart cashtags enabling real-time crypto and stock tracking, improving marke
CryptoNewsLand10h ago
