别当我財

vip
Age 0.5 Yıl
Peak Tier 3
No content yet
#ETH
Conclusion: Slightly small-range rebound in a sideways decline
Warm reminder: Both resistance and support levels can serve as entry points (averaging down points)
eth#加密市场观察
Upper resistance: 3300/3380/3450
Lower support: 3220/3170/3080
Trading strategies:
Long position strategy: If the rebound fails to firmly hold around 3300, establish a short position at the initial entry, with a re-entry point near 3450. Stop loss above 3450 after a breakout and stabilization.
First take profit: 3220 / Second take profit: 3170
Short position strategy: If the pullback fails to break below around 3240
ETH-2,52%
View Original
post-image
  • Reward
  • Comment
  • Repost
  • Share
1.6BTC/ETH Market Outlook:
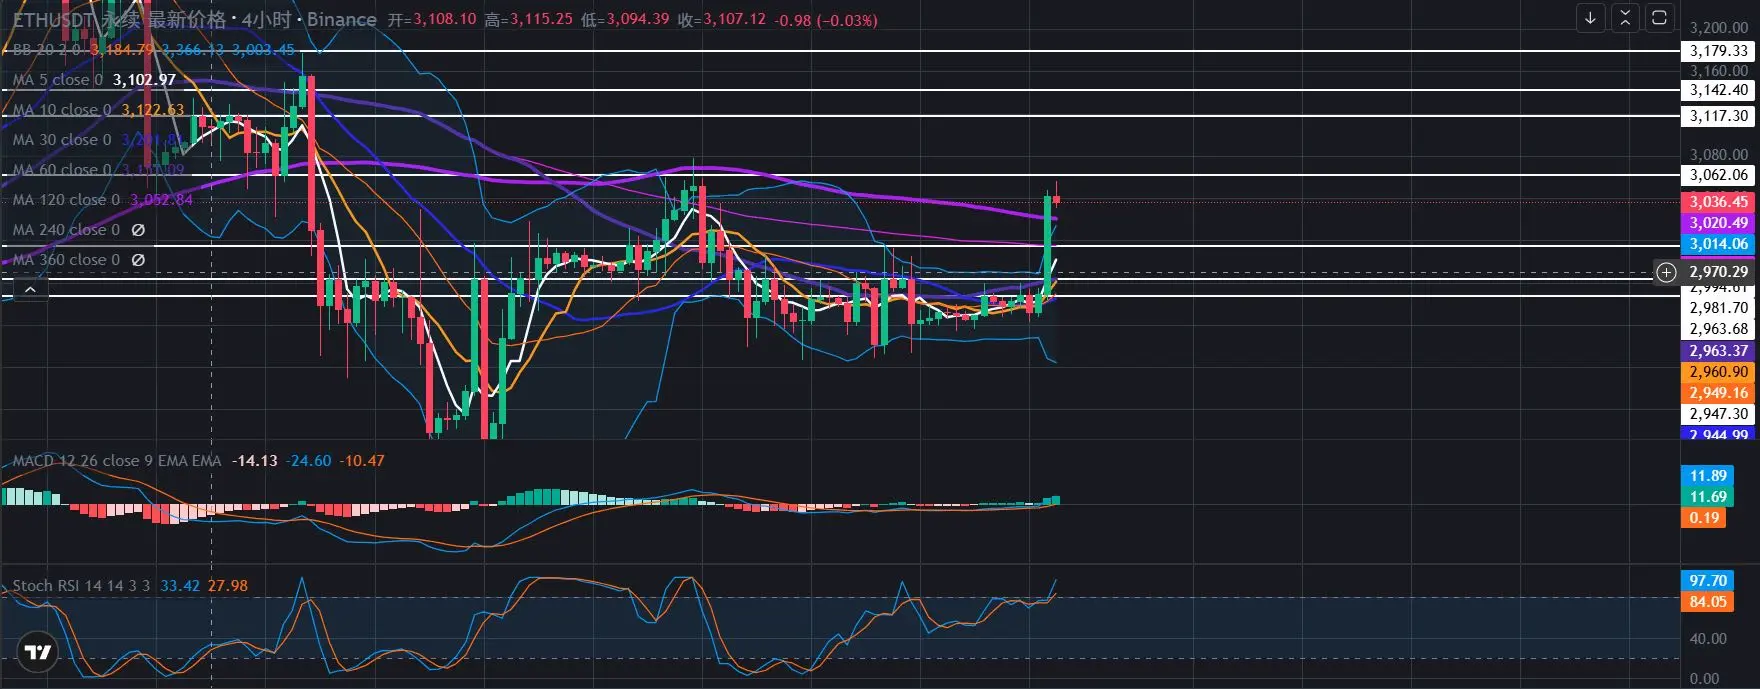
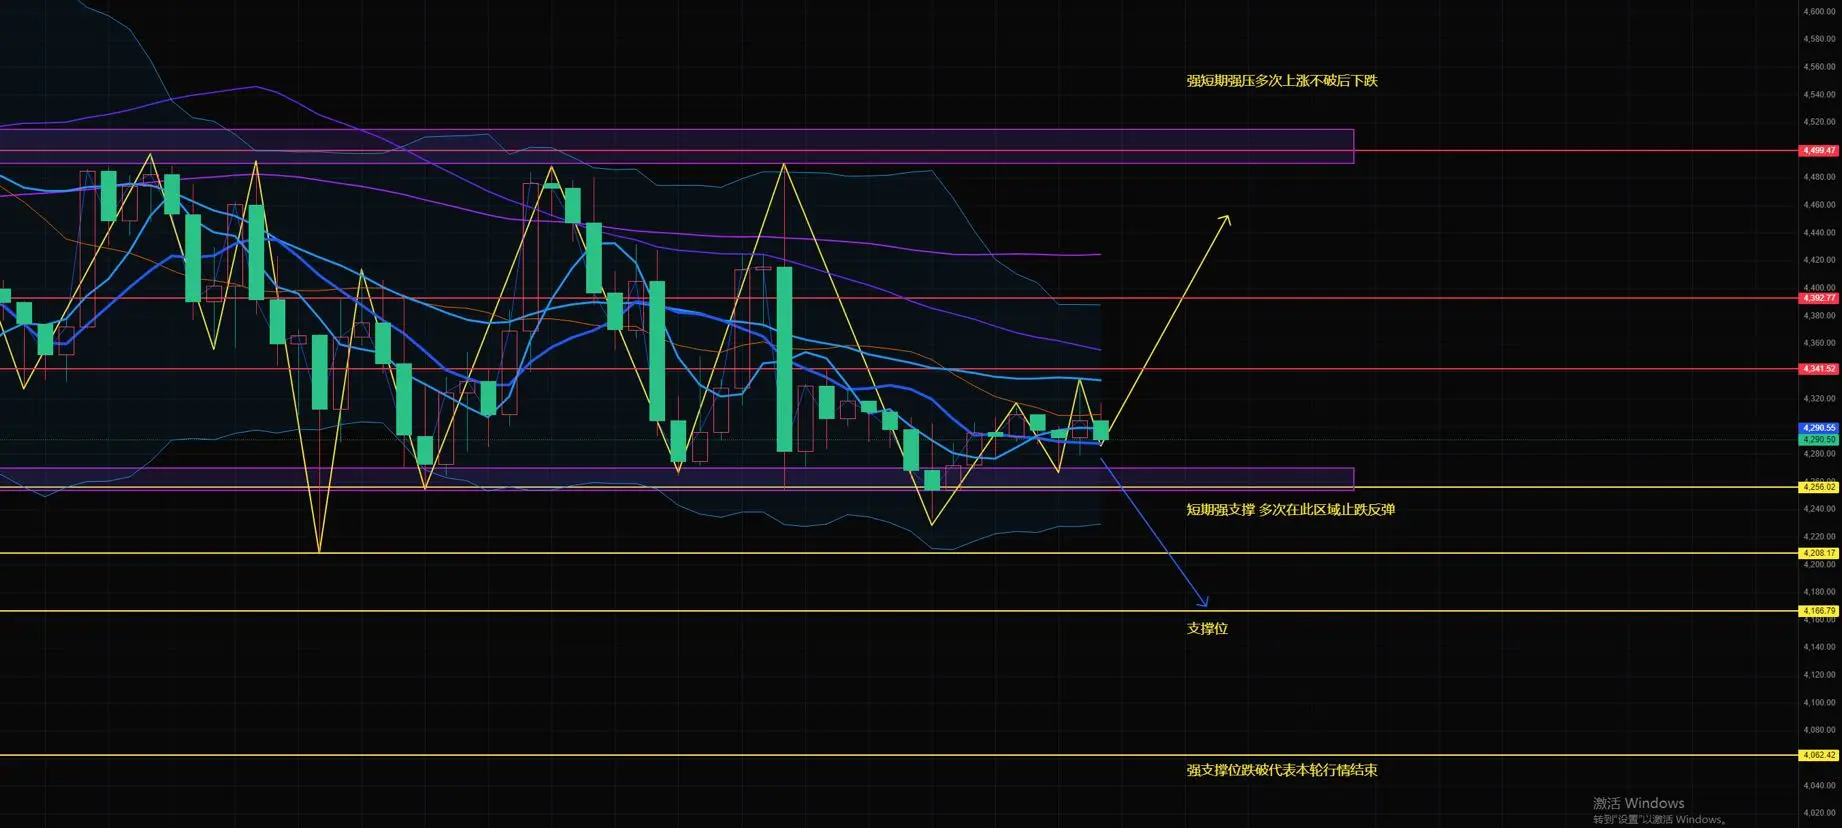
Bitcoin has been steadily rebounding, testing the previous high of 94,500, with a peak at 94,700 before pulling back. Currently, the price is oscillating around 93,700. The strategy remains unchanged this week: primarily look for long entries on dips to anticipate rebounds. Today, 94,500 will be tested again as a recent high, serving as a confidence point for the bears, a defensive level, and a key entry point for many short positions. The battle for lower prices will inevitably be intense, and this level also attracts many longs to sell. A pullback is normal, and re
ETH-2,52%
BTC-1,17%
View Original
  • Reward
  • Comment
  • Repost
  • Share
2026 1.6SOL
Review on January 5th, yesterday SOL surged to a high of 137.7 in the morning, touching the 4-hour upper band, then rebounded from the top and declined to the middle Bollinger Band at 133. Last night, the price rose above the 4-hour upper band to a high of 139.8, then pulled back to 137. Currently, it is in a downward correction phase. As long as it does not break the MA5, it will continue to rise.
The current 4-hour chart is in a downward correction after an uptrend. If the upward movement does not stabilize, the 4-hour MA5 will continue to decline. The Bollinger Bands are opening
View Original
post-image
  • Reward
  • Comment
  • Repost
  • Share
2025.12.31
Review of December 30: Yesterday, SOL was in a continuous oscillating upward trend during the daytime. Last night, the market pulled back to the 4-hour Bollinger Band middle line at 122, rebounded to the current 125, and is now in a zone of oscillating upward movement.
The current 4-hour chart is in a rebound phase after a decline. If the upward movement does not stabilize, the 4-hour MA5 will continue to decline. The Bollinger Bands are opening, with the upper band trending upward, the middle band rising, and the lower band rising—all three lines are trending upward.
The three line
View Original
  • Reward
  • Comment
  • Repost
  • Share
#ETH
Upper resistance: 3060/3120/3180
Lower support: 2990/2960/2900
Warm reminder: Both resistance and support levels can serve as entry points (averaging down points)
Recommended trading strategies:
Long position strategy: If the rebound fails to establish a solid position around 3060, open a short position, with additional entries around 3180. Break above 3180 to confirm, then set stop-loss above 3180.
First take profit: 2990 / Second take profit: 2960
Long position on dips strategy: If the pullback does not break below 2990, establish a long position, with additional entries around 2900. B
ETH-2,52%
View Original
post-image
  • Reward
  • Comment
  • 1
  • Share
The current 4-hour chart is in a retracement phase after a decline. If the price fails to stabilize during the upward move, the 4-hour MA5 will continue to decline. The Bollinger Bands are opening up, with the upper band turning downward, the middle band trending downward, and the lower band moving upward.
The three lines correspond to prices 125, 122, 120.
On the 4-hour timeframe, bullish volume is increasing, indicating a possible continued upward trend.
On the 1-hour timeframe, bullish volume is beginning to strengthen, suggesting a potential upward trend.
Moving Averages: The 4-hou
View Original
  • Reward
  • Comment
  • Repost
  • Share
The Bollinger Bands on the 4-hour chart are opening downward at prices 125, 122, 120, with the middle band trending downward. The Bollinger Bands on the 1-hour chart are opening upward at prices 124, 122, 120, with the middle band trending downward.
MA Moving Averages: On the 1-hour chart, the price is below MA5, above the lower band, with MA5 crossing above MA10, the middle band, MA30, and MA60 from below. The SOL is trending downward without breaking the middle band, and upward without breaking MA5. On the 4-hour chart, the price is below MA5, above the middle band, with MA5 turning upward a
View Original
  • Reward
  • 1
  • Repost
  • Share
Hermann11vip:
Go
ETH
On December 23, reflecting on yesterday, the overall trend was a volatile decline. Looking at the four-hour chart, it did not effectively stabilize above the short-term resistance level of ma30. The one-hour chart had several pullbacks without effectively breaking through ma5 and ma10, leading to a volatile decline.
The ETH 1-hour indicator shows that the Bollinger Bands open and close corresponds to the range of 2989-2919. The upward midline corresponds to a price of 2969, while the ETH corresponding price is 2962.
Moving Average Indicator. The MA5 and MA10 dual lines going upwards corres
ETH-2,52%
View Original
  • Reward
  • Comment
  • 1
  • Share
The current 4-hour chart is in the pullback phase after a pump. If it does not hold above during the fall, the 4-hour ma5 will continue to fall. The Bollinger Bands are opening up, with the upper band moving up, the middle band moving down, and the lower band moving down.
The three lines correspond to prices 127, 125, 124.
The bearish volume has increased on the 4-hour level, indicating a potential downtrend.
Short selling volume is beginning to strengthen in the 1-hour timeframe, which may indicate a downtrend.
Moving Average: The 4-hour chart shows a death cross between ma5 and ma10, with th
View Original
  • Reward
  • Comment
  • 1
  • Share
December 23 sol analysis
Looking back at yesterday's review, the overall trend of sol has shown relatively strong performance compared to BTC. After hitting the resistance at 130 and failing to break through, it fell back to a low of 124, then rebounded all the way up to 126 this morning.
sol analysis
The 4-hour Bollinger Bands show three parallel lines corresponding to prices of 127, 125, and 124. The middle band of the 4-hour Bollinger Bands is trending upwards. The 1-hour Bollinger Bands show three parallel lines corresponding to prices of 128, 126, and 124, with the middle band of the
BTC-1,17%
View Original
  • Reward
  • Comment
  • 1
  • Share
SOL12.22
On December 21, the overall volatility of SOL was relatively small, fluctuating within about 4 points. Currently, after the market failed to break the resistance at 128.6, there is a trend of correction.
Technical Analysis
The Bollinger Bands are narrowing on the 4-hour chart, with the middle line moving upward. The corresponding prices for the three lines are: 128.6-125.2-121.8. The market is rising, and it is currently attempting to break through the upper Bollinger Band line but has not touched it, leading to a pullback and fluctuation. The MA moving averages indicate that the shor
View Original
  • Reward
  • Comment
  • Repost
  • Share
From the 4-hour chart, it is currently experiencing a technical Rebound after piercing the lower band of the Bollinger Bands, with the three lines opening outward and trending downward, corresponding to prices of 4767-4618-4470.
2. MA Moving Average Indicator Performance
From the 4-hour chart, it is currently experiencing a technical Rebound after breaking through the lower band of the Bollinger Bands. The three lines are opening outward, showing a trend of opening downward, corresponding to prices of 4767-4618-4470.
3. MACD and RSI Indicator Analysis
In the 4-hour MACD chart, the fast line ha
View Original
post-image
  • Reward
  • Comment
  • 1
  • Share
First, let's look at the daily chart. Currently, the market is experiencing a technical pullback after piercing the upper band of the Bollinger Bands. It is currently above the support at the MA5 corresponding price of 4605, with support concentrated between 4450 and 4420 below. On the hourly chart, it is in a state of oscillating decline, about to pierce the lower band of the hourly Bollinger Bands, with the market oscillating downward. The MA moving average indicators are currently showing a transition from long positions to short positions. If the short-term moving average crosses down
ETH-2,52%
View Original
post-image
  • Reward
  • Comment
  • Repost
  • Share
Ethereum yesterday review
Yesterday during the day, Ethereum showed an overall decline, rebounding after hitting the lower Bollinger Band and stabilizing at the middle band, then rebounding again. In the evening, the market was influenced by the opening of the US stock market and the US non-farm payroll data. Ethereum attempted to rise to 4360 but quickly fell over 100 points to 4270, indicating strong bearish momentum in the market. According to the latest data from Coinglass, if Ethereum breaks through 4524 USD, the cumulative liquidation strength of short positions on mainstream CEXs will r
ETH-2,52%
MA-4,01%
View Original
post-image
  • Reward
  • Comment
  • Repost
  • Share
From the 4-hour chart, it is currently in a rebound after falling below the lower band of the Bollinger Bands, but it has not effectively formed a breakout to hold above the middle band line at 4309. The Bollinger Bands are narrowing, and the middle band is trending upwards, corresponding to a price rise. The three lines of the Bollinger Bands correspond to prices 4230--4309--4388. From the 4-hour chart, the volume of long positions is gradually increasing, and after holding above the middle band line, there may be an upward attempt to test the upper band.
The 4-hour chart's short-term MA
MA-4,01%
View Original
post-image
  • Reward
  • Comment
  • Repost
  • Share
1. BOLL Indicator Interpretation
The 4-hour BOLL is in an opening state, corresponding to prices 4234-4353-4472, with the middle line trending downwards, indicating a bearish market.
2. Performance of MA Moving Average Indicator
MA moving average indicator, the short-term moving average is below the mid-term moving average and continues to move downward, the market changes from bullish to bearish, fluctuating downwards.
3. Analysis of MACD and RSI Indicators
The MACD indicator is in a parallel position below the dead cross near the 0 axis, with the two lines almost parallel, indicating market
MA-4,01%
View Original
post-image
  • Reward
  • Comment
  • Repost
  • Share
2025.9.3
#BTC
From the 4-hour perspective, the Bollinger Bands are opening upwards, with the middle line trending upwards. The market is biased towards an upward direction, currently in a pullback after rising to the upper band of the Bollinger Bands. As long as the pullback does not break the 108700 middle line, the market will continue to move upwards.
The short-term moving averages are parallel on the 1-hour chart, corresponding to market fluctuations. BTC is currently positioned between MA5 and MA10. If it can stabilize above the short-term moving averages, it will test the upper Bolling
View Original
post-image
  • Reward
  • Comment
  • Repost
  • Share
  • Pin

Trade Crypto Anywhere Anytime
qrCode
Scan to download Gate App
Community
  • 简体中文
  • English
  • Tiếng Việt
  • 繁體中文
  • Español
  • Русский
  • Français (Afrique)
  • Português (Portugal)
  • Bahasa Indonesia
  • 日本語
  • بالعربية
  • Українська
  • Português (Brasil)