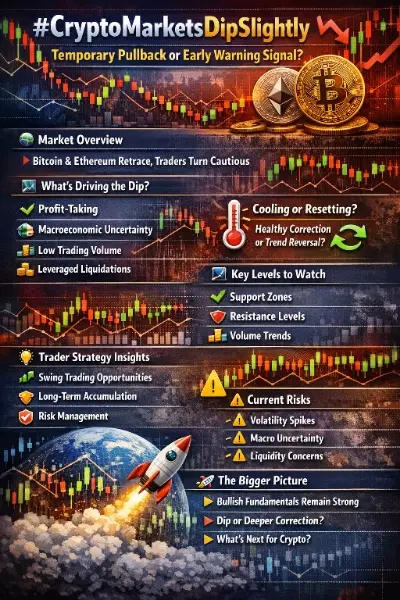


#CryptoMarketsDipSlightly
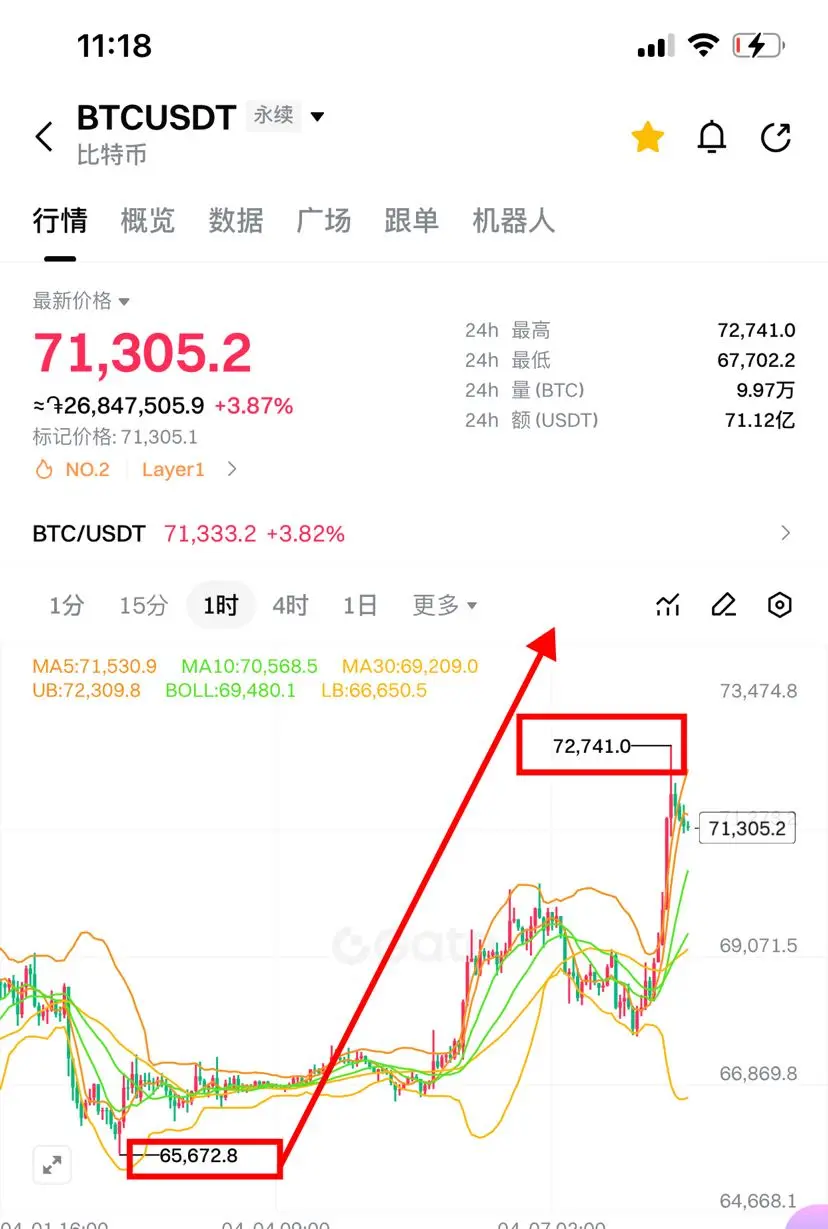
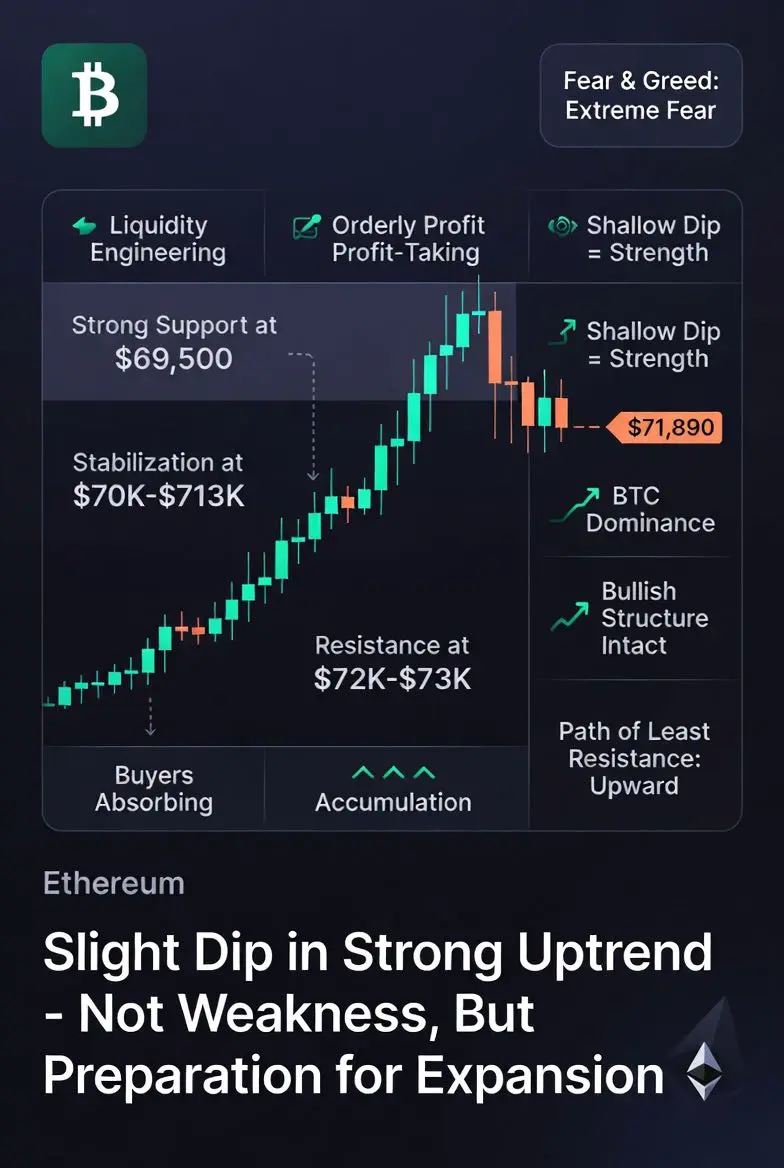
As of now, Bitcoin (BTC) is trading around $71,890, and what we are witnessing is not a breakdown, not a reversal, and definitely not weakness — it is a controlled, calculated, and technically necessary slight dip after tapping the $72K liquidity zone. This distinction is extremely important, because most retail traders misinterpret these small pullbacks as bearish signals, while in reality, they are often the foundation of the next upward expansion.
Let’s break this down with deeper clarity and sharper market understanding 👇
🔴 The Meaning of a “Slight Dip” (Not a Crash, Not a Reversal)
The move from ~$72,800 down toward the $70K–$71K region is very shallow in percentage terms, especially considering the strong impulsive move from $67K. A drop of less than 2–3% at these levels is structurally insignificant — in fact, it signals strength, not weakness.
This kind of dip shows:
Buyers are not aggressively exiting
Sellers are not dominating the order book
The market is cooling down, not collapsing
In strong bullish structures, price does not move vertically forever — it breathes, pauses, and then continues.
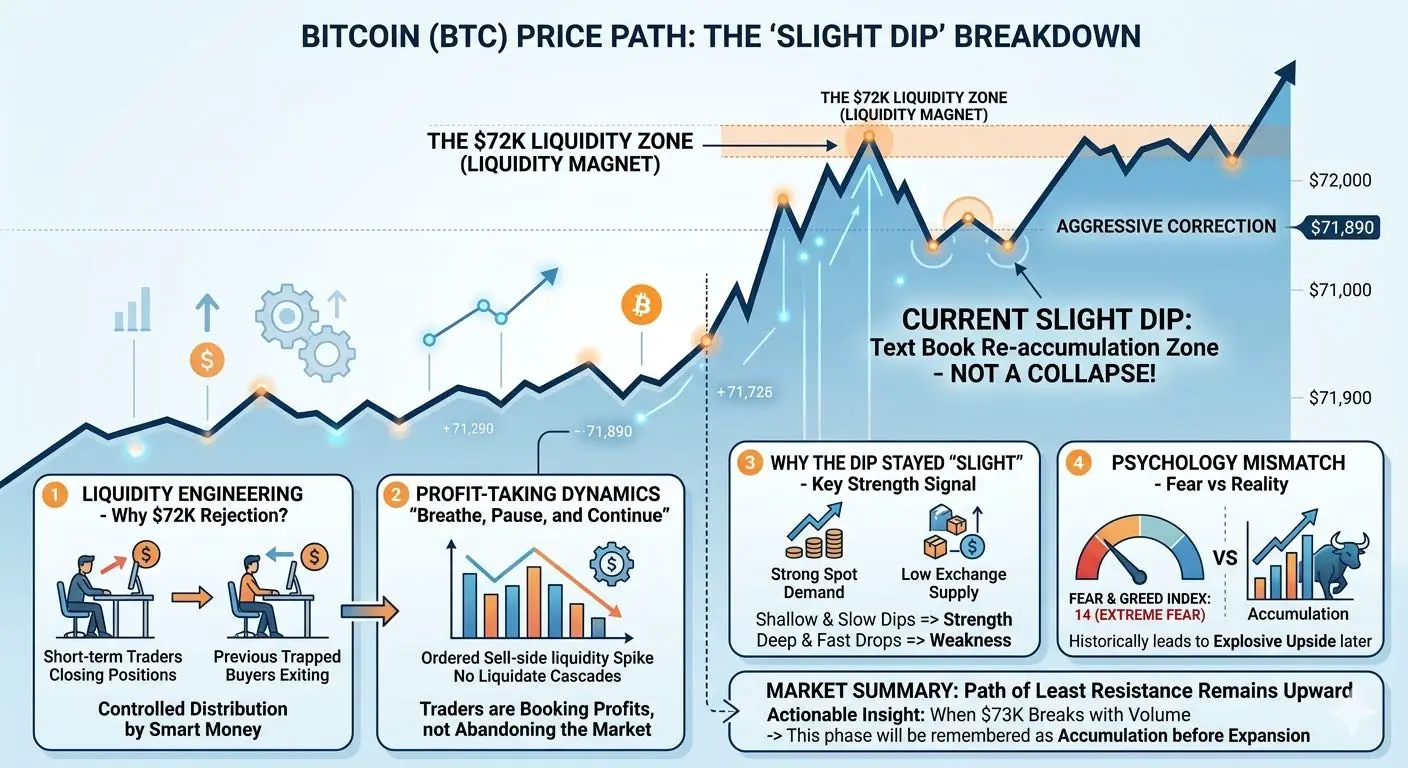
🧠 Liquidity Engineering — Why $72K Caused a Reaction
The $72K–$73K region acted as a liquidity magnet, not just resistance. When price reached this zone:
Previous trapped buyers exited at breakeven
Short-term traders closed positions
Smart money distributed partially
This created a temporary supply spike, which pushed price slightly lower — but notice the key word: slightly.
If the market was weak, we would have seen:
A sharp rejection (5–10% drop)
Panic selling
High-volume breakdown
Instead, we got a controlled pullback, which confirms that: 👉 Demand is still present
👉 Buyers are absorbing sell pressure
💰 Profit-Taking — Healthy, Not Bearish
After a clean rally from $67K → $72K+, the market needed profit-taking.
But here’s the critical insight:
Selling was orderly, not aggressive
No cascade of liquidations occurred
Price held above key support zones
This tells us: 👉 Traders are booking profits, but not abandoning the market
👉 Capital is rotating, not exiting
A market that cannot pull back is unstable — this dip actually stabilizes the trend.
📉 Why the Dip Stayed “Slight” (Key Strength Signal)
The most important part of this entire move is not the dip itself — it’s how small and controlled it remained.
Reasons:
Strong spot demand absorbing selling
Low exchange supply limiting downside pressure
Institutional positioning supporting dips
No panic sentiment spike, despite Fear Index being low
This creates a situation where: 👉 Every dip gets bought quietly
👉 Price refuses to break structure
This is classic accumulation within an uptrend.
🧠 Psychology Mismatch — Fear vs Reality
The Fear & Greed Index at 14 (Extreme Fear) is completely disconnected from price structure.
This creates a powerful dynamic:
Retail: “Market is weak, it will fall”
Smart money: “Market is stable, keep accumulating”
Historically, when:
Price holds strong
Fear remains high
👉 It often leads to explosive upside later
Because once sentiment flips, late buyers chase price upward aggressively.
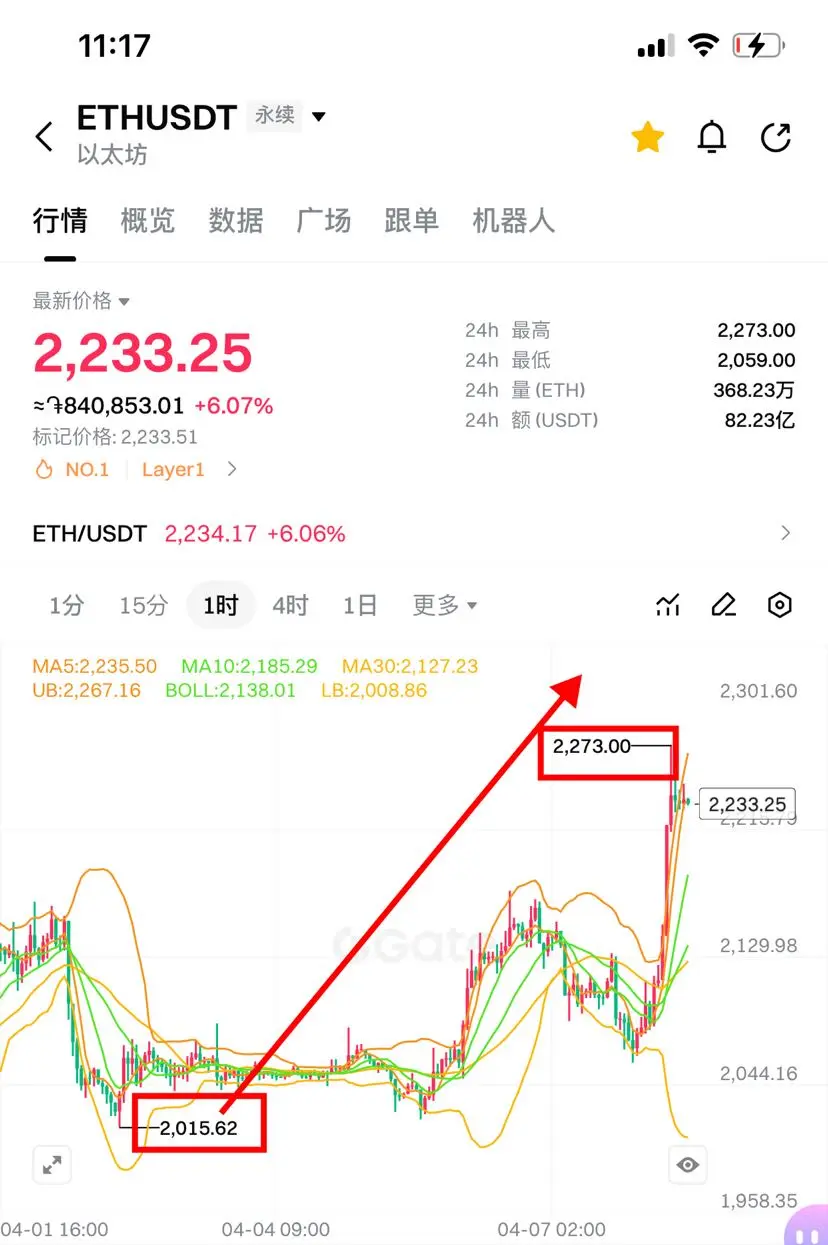
📊 Ethereum’s Larger Dip — Confirming BTC Strength
Ethereum dropping more (~2.4%) while BTC barely dips shows:
BTC is acting as the market anchor
Altcoins are still in recovery mode
This divergence is important: 👉 When BTC stabilizes, altcoins usually lag
👉 When BTC breaks out, altcoins accelerate
So this slight BTC dip is not weakness — it is dominance strength.
⚖️ Market Structure — Still Bullish
Even after the dip, structure remains intact:
$69,500 → Strong support
$70K–$71K → Stabilization zone
$72K–$73K → Resistance / breakout trigger
As long as BTC holds above ~$69.5K: 👉 The trend is unchanged bullish
A slight dip above support = continuation pattern, not reversal.
🚀 What This Slight Dip Actually Signals
This is the most important conclusion:
This dip is:
A liquidity reset
A momentum cooling phase
A re-accumulation zone
NOT:
A bearish reversal
A structural breakdown
A market failure
In fact, the shallower the dip: 👉 The stronger the underlying demand
🎯 Strategic Insight (Advanced View)
Smart traders don’t react emotionally to dips — they read depth and behavior:
Deep, fast drops → weakness
Shallow, slow dips → strength
Right now we are clearly seeing: 👉 Shallow + controlled = bullish continuation bias
🧾 Final Verdict — The Reality Behind the Dip
The move from $72K down to around $71,890 is a textbook example of a slight dip inside a strong trend, driven by liquidity interaction, profit-taking, and psychological hesitation — not by any real weakness in the market.
The market is not rejecting higher prices — it is simply preparing for them.
As long as structure holds and dips remain shallow: 👉 The path of least resistance remains upward
And when $73K breaks with volume: 👉 This “slight dip phase” will be remembered as accumulation before expansion.
As of now, Bitcoin (BTC) is trading around $71,890, and what we are witnessing is not a breakdown, not a reversal, and definitely not weakness — it is a controlled, calculated, and technically necessary slight dip after tapping the $72K liquidity zone. This distinction is extremely important, because most retail traders misinterpret these small pullbacks as bearish signals, while in reality, they are often the foundation of the next upward expansion.
Let’s break this down with deeper clarity and sharper market understanding 👇
🔴 The Meaning of a “Slight Dip” (Not a Crash, Not a Reversal)
The move from ~$72,800 down toward the $70K–$71K region is very shallow in percentage terms, especially considering the strong impulsive move from $67K. A drop of less than 2–3% at these levels is structurally insignificant — in fact, it signals strength, not weakness.
This kind of dip shows:
Buyers are not aggressively exiting
Sellers are not dominating the order book
The market is cooling down, not collapsing
In strong bullish structures, price does not move vertically forever — it breathes, pauses, and then continues.
🧠 Liquidity Engineering — Why $72K Caused a Reaction
The $72K–$73K region acted as a liquidity magnet, not just resistance. When price reached this zone:
Previous trapped buyers exited at breakeven
Short-term traders closed positions
Smart money distributed partially
This created a temporary supply spike, which pushed price slightly lower — but notice the key word: slightly.
If the market was weak, we would have seen:
A sharp rejection (5–10% drop)
Panic selling
High-volume breakdown
Instead, we got a controlled pullback, which confirms that: 👉 Demand is still present
👉 Buyers are absorbing sell pressure
💰 Profit-Taking — Healthy, Not Bearish
After a clean rally from $67K → $72K+, the market needed profit-taking.
But here’s the critical insight:
Selling was orderly, not aggressive
No cascade of liquidations occurred
Price held above key support zones
This tells us: 👉 Traders are booking profits, but not abandoning the market
👉 Capital is rotating, not exiting
A market that cannot pull back is unstable — this dip actually stabilizes the trend.
📉 Why the Dip Stayed “Slight” (Key Strength Signal)
The most important part of this entire move is not the dip itself — it’s how small and controlled it remained.
Reasons:
Strong spot demand absorbing selling
Low exchange supply limiting downside pressure
Institutional positioning supporting dips
No panic sentiment spike, despite Fear Index being low
This creates a situation where: 👉 Every dip gets bought quietly
👉 Price refuses to break structure
This is classic accumulation within an uptrend.
🧠 Psychology Mismatch — Fear vs Reality
The Fear & Greed Index at 14 (Extreme Fear) is completely disconnected from price structure.
This creates a powerful dynamic:
Retail: “Market is weak, it will fall”
Smart money: “Market is stable, keep accumulating”
Historically, when:
Price holds strong
Fear remains high
👉 It often leads to explosive upside later
Because once sentiment flips, late buyers chase price upward aggressively.
📊 Ethereum’s Larger Dip — Confirming BTC Strength
Ethereum dropping more (~2.4%) while BTC barely dips shows:
BTC is acting as the market anchor
Altcoins are still in recovery mode
This divergence is important: 👉 When BTC stabilizes, altcoins usually lag
👉 When BTC breaks out, altcoins accelerate
So this slight BTC dip is not weakness — it is dominance strength.
⚖️ Market Structure — Still Bullish
Even after the dip, structure remains intact:
$69,500 → Strong support
$70K–$71K → Stabilization zone
$72K–$73K → Resistance / breakout trigger
As long as BTC holds above ~$69.5K: 👉 The trend is unchanged bullish
A slight dip above support = continuation pattern, not reversal.
🚀 What This Slight Dip Actually Signals
This is the most important conclusion:
This dip is:
A liquidity reset
A momentum cooling phase
A re-accumulation zone
NOT:
A bearish reversal
A structural breakdown
A market failure
In fact, the shallower the dip: 👉 The stronger the underlying demand
🎯 Strategic Insight (Advanced View)
Smart traders don’t react emotionally to dips — they read depth and behavior:
Deep, fast drops → weakness
Shallow, slow dips → strength
Right now we are clearly seeing: 👉 Shallow + controlled = bullish continuation bias
🧾 Final Verdict — The Reality Behind the Dip
The move from $72K down to around $71,890 is a textbook example of a slight dip inside a strong trend, driven by liquidity interaction, profit-taking, and psychological hesitation — not by any real weakness in the market.
The market is not rejecting higher prices — it is simply preparing for them.
As long as structure holds and dips remain shallow: 👉 The path of least resistance remains upward
And when $73K breaks with volume: 👉 This “slight dip phase” will be remembered as accumulation before expansion.