Terra (LUNA), MemeCore (M), and XDC Network (XDC) stand out as the top performers in the past 24 hours. LUNA leads with an impressive breakout of 40%, while MemeCore and XDC continue their positive momentum on Thursday, following gains of 6% and 3% respectively from the previous session. However, technically, all three altcoins are approaching key resistance zones – a factor that could temporarily hinder the current rebound.
Terra’s Uptrend Reaches Critical Resistance Zone
At the time of writing on Thursday, Terra is trading around $0.2002, experiencing nearly 100% growth in just one week. This strong breakout aims to close a clear candle above the July high at $0.1990 — a signal that could open up opportunities to conquer the important resistance area at $0.2490 (May’s peak).
Terra’s remarkable recovery, along with Luna Classic, is likely driven by the testimony of Do Kwon on Thursday, combined with a new network upgrade aimed at improving security, optimizing functions, and increasing stability across the Terra ecosystem.
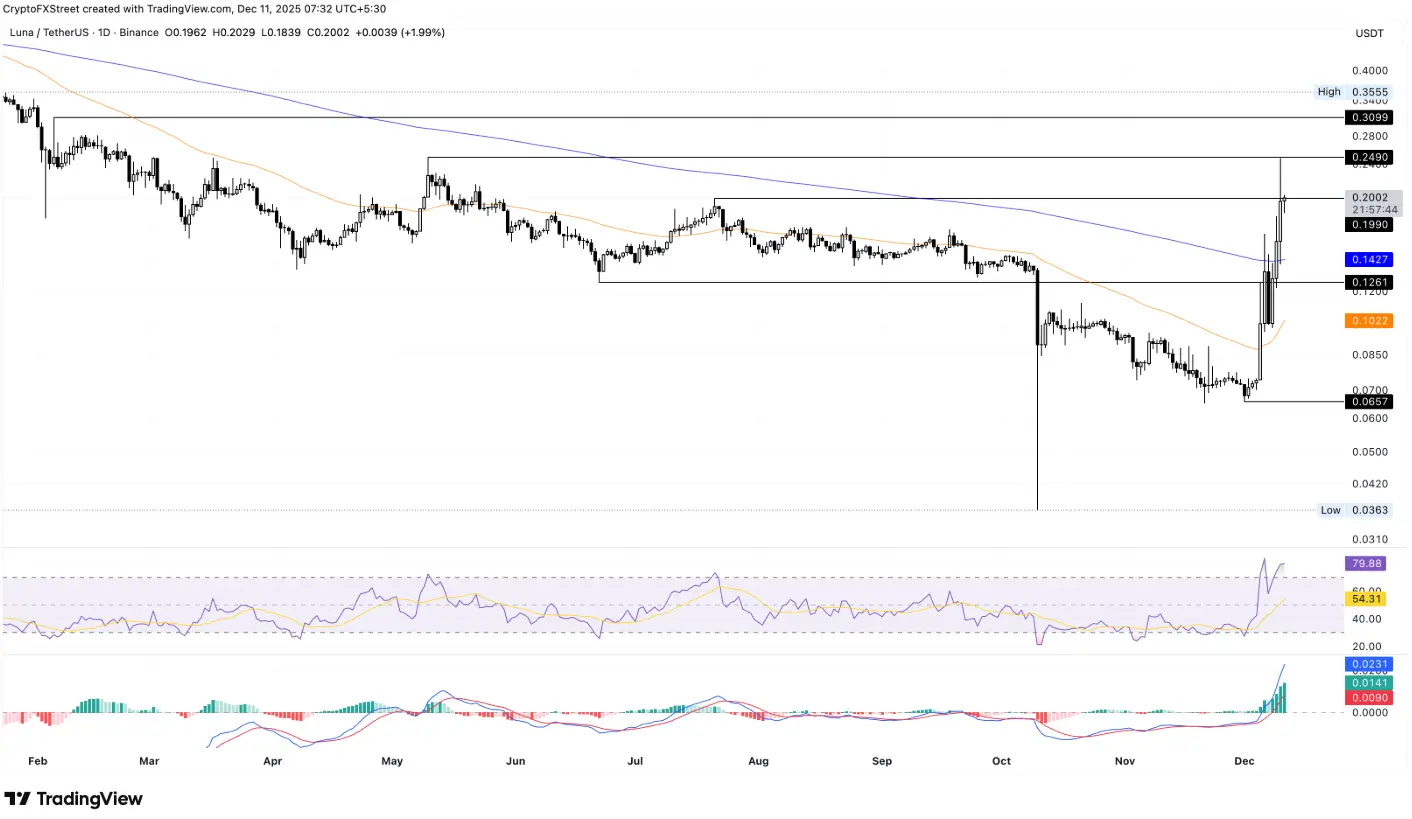 Daily LUNA/USDT chart | Source: TradingViewOn the daily chart, the RSI indicator reaches 79, indicating an overbought market, which suggests that current buying momentum may lack sustainability. However, the MACD remains bullish with a widening green histogram, reflecting ongoing upward momentum.
Conversely, if Terra fails to hold above $0.2000, the price could revisit the 200-day EMA at $0.1427.
MemeCore aims for double bottom breakout
MemeCore continues to stay green in Thursday’s session, marking a third consecutive day of recovery. This week alone, the M token has increased by nearly 16%, after a 6% jump on Wednesday.
The steady recovery suggests the formation of a double bottom pattern (double bottom) around the support zone of $1.25, with the neckline (neckline) at the November 29 peak of $1.52. If M closes above this level, the bullish trend could extend to the 50-day EMA at $1.77, and potentially toward the Pivot R1 at $2.56.
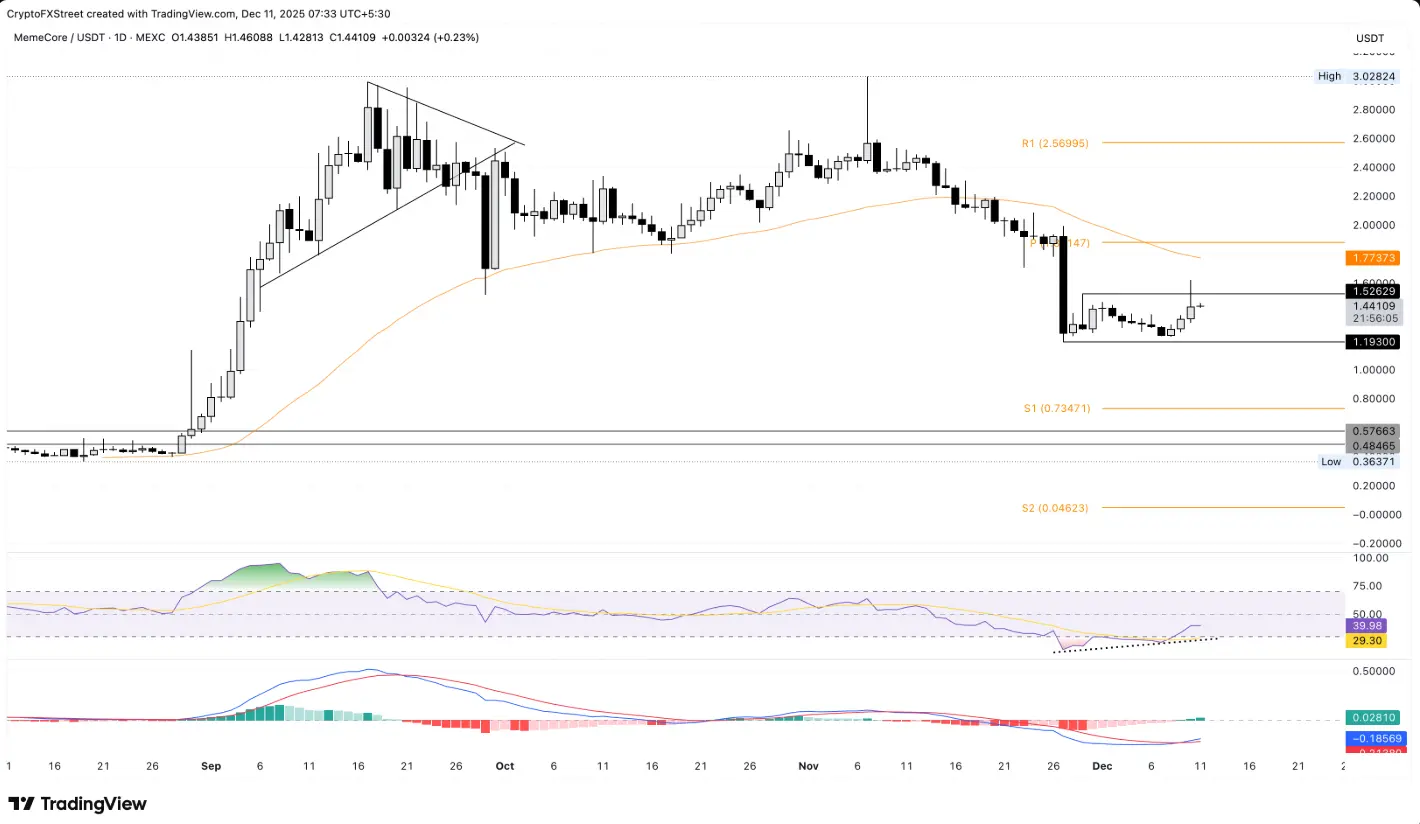 Daily M/USDT chart | Source: TradingView RSI is currently at 39 and rising from oversold territory, indicating a bullish divergence and reinforcing the reversal signal from the double bottom pattern — thereby increasing the likelihood of a new upward trend.
Additionally, the MACD supports the bullish outlook, as it crossed above the signal line on Tuesday, expanding buy signals for MemeCore and indicating strengthening bullish momentum.
XDC Network Faces Challenges at Key Psychological Level
XDC Network experienced a nearly 1% decline at the time of writing on Thursday, following a 3% rebound the previous day. The correction kept XDC below the psychological level of $0.05000 and failed to break above the long-term resistance line connecting the peaks on July 29 and October 6.
To resume its upward trend, XDC needs a clear breakout above $0.05000 before testing the next resistance zone at $0.05200. However, two major hurdles remain ahead: the 50-day EMA at $0.05502 and Pivot R1 at $0.06141.
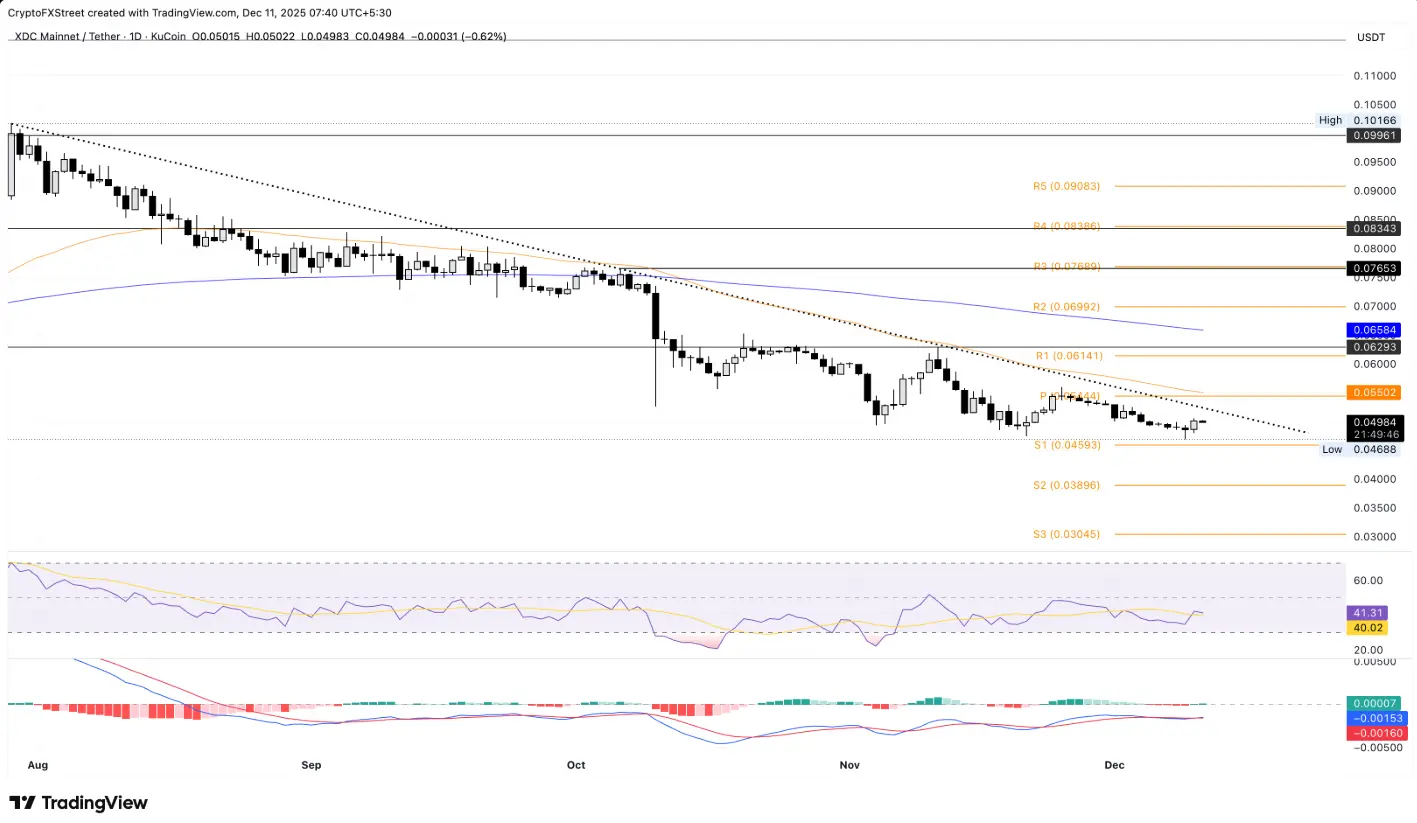 Daily XDC/USDT chart | Source: TradingViewFrom a technical perspective, the RSI at 41 is gradually moving toward oversold territory, reflecting persistent downward pressure. Conversely, the MACD indicates a positive signal with a bullish crossover — suggesting a potential recovery.
In a negative scenario, if XDC loses support at Pivot S1 (0.04593 USD), the price could continue to drop toward Pivot S2 at $0.03896.
Disclaimer: The information on this page may come from third parties and does not represent the views or opinions of Gate. The content displayed on this page is for reference only and does not constitute any financial, investment, or legal advice. Gate does not guarantee the accuracy or completeness of the information and shall not be liable for any losses arising from the use of this information. Virtual asset investments carry high risks and are subject to significant price volatility. You may lose all of your invested principal. Please fully understand the relevant risks and make prudent decisions based on your own financial situation and risk tolerance. For details, please refer to
Disclaimer.
Related Articles
Raoul Pal: Global liquidity and BTC correlation reach 90%, and the market is in a historically oversold state
Raoul Pal stated on March 8th that global liquidity is a key macro factor, highly correlated with BTC and NDX since 2012, with an annual growth of about 10%. He pointed out that liquidity remains loose and predicted that the US will further cut interest rates to stimulate disposable income. The crypto market is currently oversold, and the next two weeks will be a critical period to watch.
GateNews47m ago
Woo on BTC Price: 'Bull Trap Incoming' - U.Today
Willy Woo warns investors against short-term optimism in Bitcoin's price, indicating a potential bear trap despite possible relief rallies. He emphasizes that the market remains in a bearish phase and that the current conditions do not signify a market bottom.
UToday2h ago
After a 15% drop from the weekly high, is Ethena facing the risk of a deeper decline?
Ethena (ENA) experienced a brief surge to $0.12, driven by optimistic sentiment and increased trading volume. However, it has since dropped about 15%, revealing long-term bearish trends. Resistance levels suggest potential further declines towards $0.085.
TapChiBitcoin2h ago
Dogecoin Price Jumps as Derivatives Demand Signals Breakout
Key Insights
Dogecoin surged to a weekly high of $0.103 as improving market sentiment and strong derivatives demand encouraged traders to position for further gains.
Futures data from CoinGlass showed a positive funding rate, indicating long traders are paying premiums while positioning for
CryptoFrontNews2h ago
Hidden "Death Spiral" Risk! Ethereum and Bitmine targeted by short-selling institutions
Ethereum is about to undergo a major upgrade, and the market is highly focused on it. However, short-selling firm Culper Research believes that the Ethereum economic model is failing and warns of a potential "death spiral." They point out that a significant drop in transaction fees and shrinking staking rewards will impact network security. The report also mentions Vitalik Buterin selling Ethereum and questions the market fundamentals, suggesting that Ethereum is facing a new reality.
区块客3h ago