
Date: Sat, Jan 03, 2026 | 06:50 PM GMT
As 2026 kicks off, the broader cryptocurrency market is showing renewed stability. Ethereum (ETH) has reclaimed the $3,100 mark, and momentum is gradually spreading across major altcoins — including Bittensor (TAO).
TAO is trading around 3% higher on the day, extending its weekly gains to nearly 14%. While the short-term strength is encouraging, the more important development lies in the structure forming on the chart. Recent price action suggests a meaningful shift in market behavior — one that could signal the early stages of a bullish continuation if key levels are reclaimed.
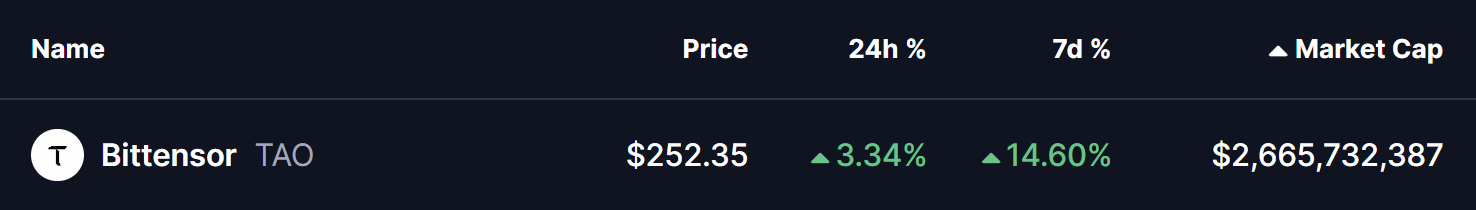
Source: Coinmarketcap
Rounding Bottom Pattern Takes Shape
On the 4-hour timeframe, Bittensor appears to be forming a rounding bottom pattern, a classic bullish reversal structure that typically develops after an extended corrective phase. This pattern reflects a gradual transition from distribution to accumulation, where selling pressure fades and buyers begin to step in more consistently.
The setup began after TAO faced a firm rejection near the $315 neckline resistance, which triggered a sharp decline through late November and December. That move eventually found strong demand near the $206 support zone, where selling momentum stalled. Multiple defenses of this level prevented any deeper breakdown and helped establish a solid base for a potential trend reversal.
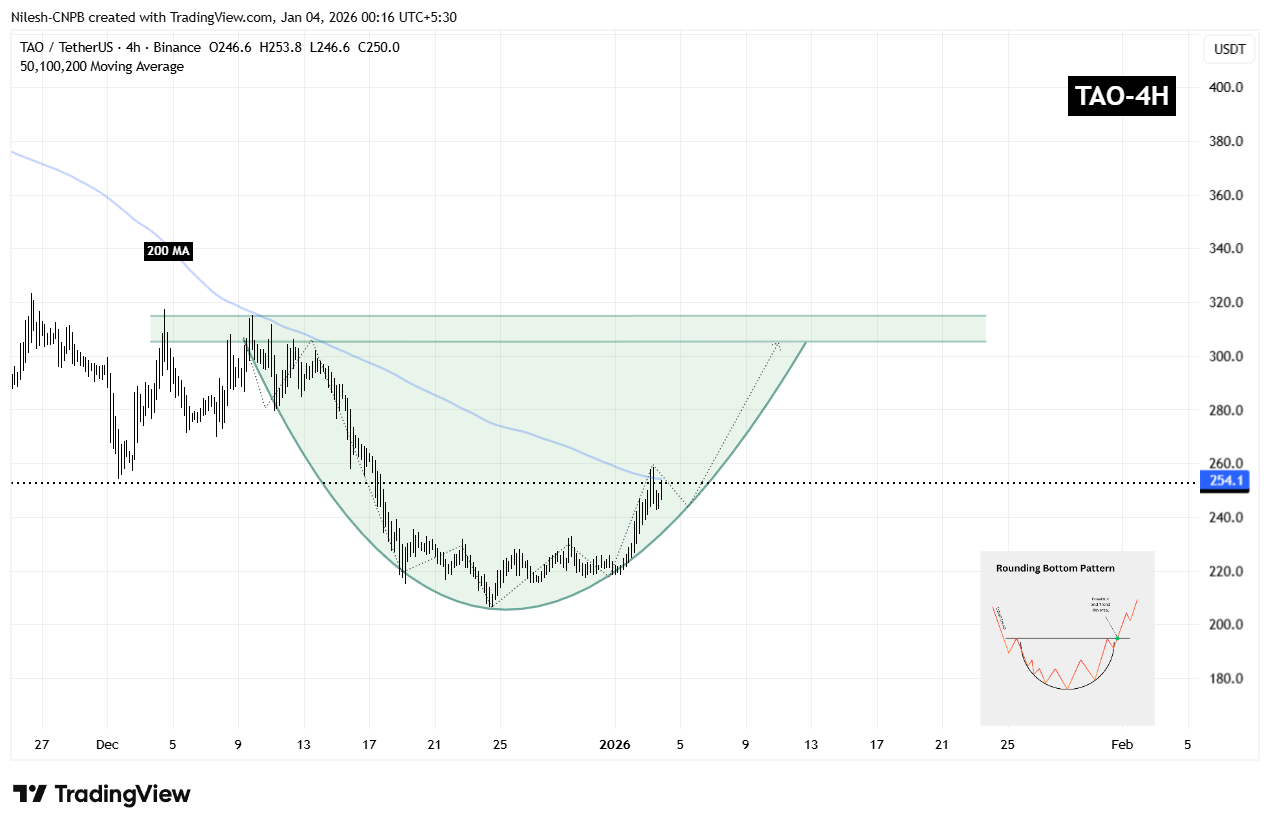
Bittensor (TAO) 4H Chart/Coinsprobe (Source: Tradingview)
Since carving out that bottom, TAO has started to curve higher in a smooth, rounded fashion — closely matching the textbook structure of a developing rounding bottom. The recent recovery has also brought price back toward the 200-period moving average near $254, a level that previously acted as resistance and is now being tested as potential support.
What’s Next for TAO?
If TAO manages to hold above the 200 MA, that level could act as short-term support and provide a foundation for further upside attempts. A clean breakout above the $315 resistance zone, followed by sustained acceptance above it, would validate the entire reversal structure and likely open the door for a broader bullish expansion phase, with momentum traders re-entering the market.
Until that breakout occurs, the pattern remains in development. Short-term consolidation or shallow pullbacks remain possible, particularly as price digests recent gains. However, as long as TAO continues to maintain higher lows above the established base, the broader bottoming structure remains intact and constructive.
For now, the chart suggests that TAO is approaching a critical confirmation phase — one that could determine whether this recovery evolves into a sustained bullish trend as the new year unfolds.
Disclaimer: The views and analysis presented in this article are for informational purposes only and reflect the author’s perspective, not financial advice. Technical patterns and indicators discussed are subject to market volatility and may or may not yield the anticipated results. Investors are advised to exercise caution, conduct independent research, and make decisions aligned with their individual risk tolerance.
About Author: Nilesh Hembade is the Founder and Lead Author of Coinsprobe, with over 5 years of experience in the cryptocurrency and blockchain industry. Since launching Coinsprobe in 2023, he has been providing daily, research-driven insights through in-depth market analysis, on-chain data, and technical research.
Disclaimer: The information on this page may come from third parties and does not represent the views or opinions of Gate. The content displayed on this page is for reference only and does not constitute any financial, investment, or legal advice. Gate does not guarantee the accuracy or completeness of the information and shall not be liable for any losses arising from the use of this information. Virtual asset investments carry high risks and are subject to significant price volatility. You may lose all of your invested principal. Please fully understand the relevant risks and make prudent decisions based on your own financial situation and risk tolerance. For details, please refer to
Disclaimer.
Related Articles
Ethereum Activity at All-Time Highs Due to Mass Capitulation - U.Today
Ethereum's network shows high activity, surpassing 2021 metrics, but this surge is due to investors selling rather than genuine demand. Liquidity is declining as users withdraw capital to exchanges, signaling potential challenges ahead.
UToday1h ago
Dogecoin Tests $0.090 Support After 3.4% Drop as Traders Watch Key Price Range
Dogecoin is currently trading at $0.09061 which is a drop of 3.4 percent, and the price is close to the important level of $0.09011 support.
The chart indicates a series of tests of the support zone of $0.089-$0.090, and the closest resistance is represented by $0.09353.
A hold of
CryptoNewsLand2h ago
PEPE Price at $0.053259 as Tight Range and Falling Volume Shape Short-Term Market Activity
PEPE was traded at $0.053259 and has recorded a 3.0 percent fall in value but it is within a thin band of support and resistance.
The market exhibited a volume of 235.15M in 24 hour trading, which is a decline of 19.16% reflecting less trading activity.
Technical indicators are not
CryptoNewsLand2h ago
XRP ETF Performance Praised as 'Really Impressive' by Bloomberg - U.Today
XRP ETFs have shown resilience amid a 45% price drop, attracting significant capital despite typical market behavior. Bloomberg's Eric Balchunas highlights strong investor support. Despite recent outflows, the funds retain substantial assets, indicating community dedication.
UToday2h ago
Crypto Shines Amid Middle East Oil Shock and Market Selloff
Bitcoin remains stable amid market turmoil fueled by rising oil prices and inflation, outperforming traditional assets. Its reduced leverage limits forced selling, attracting long-term investors eyeing potential gains in a volatile landscape.
CryptoFrontNews3h ago
XRP Holds $1.34 Support While Leverage Heatmap Highlights $1.30 Risk Zone
XRP is trading at $1.36 in a tight range of support at $1.34 and resistance at $1.37.
The heatmap data indicates that there is a huge amount of long positions in the range of $1.30.
Should prices fall to around $1.30, long positions with high leverage in this region might
CryptoNewsLand3h ago