After the previous bullish momentum weakened and the price corrected to a low of $2.03, RENDER experienced an impressive recovery, rising 22% from the bottom of $2.2 to a two-month high of $2.7, surpassing the 20, 50, and 100-day EMAs.
At the time of this writing, RENDER’s price has slightly corrected, trading around $2.47, up 8.2% from the previous day. Notably, trading volume also surged 230% to $242 million USD, reflecting a strong renewed interest from the market.
Render attracts new market attention
Recently, market sentiment towards RENDER turned negative, leading investors to increase spending significantly. However, on 1/11, this trend reversed sharply as buying pressure returned strongly, boosting accumulation activity.
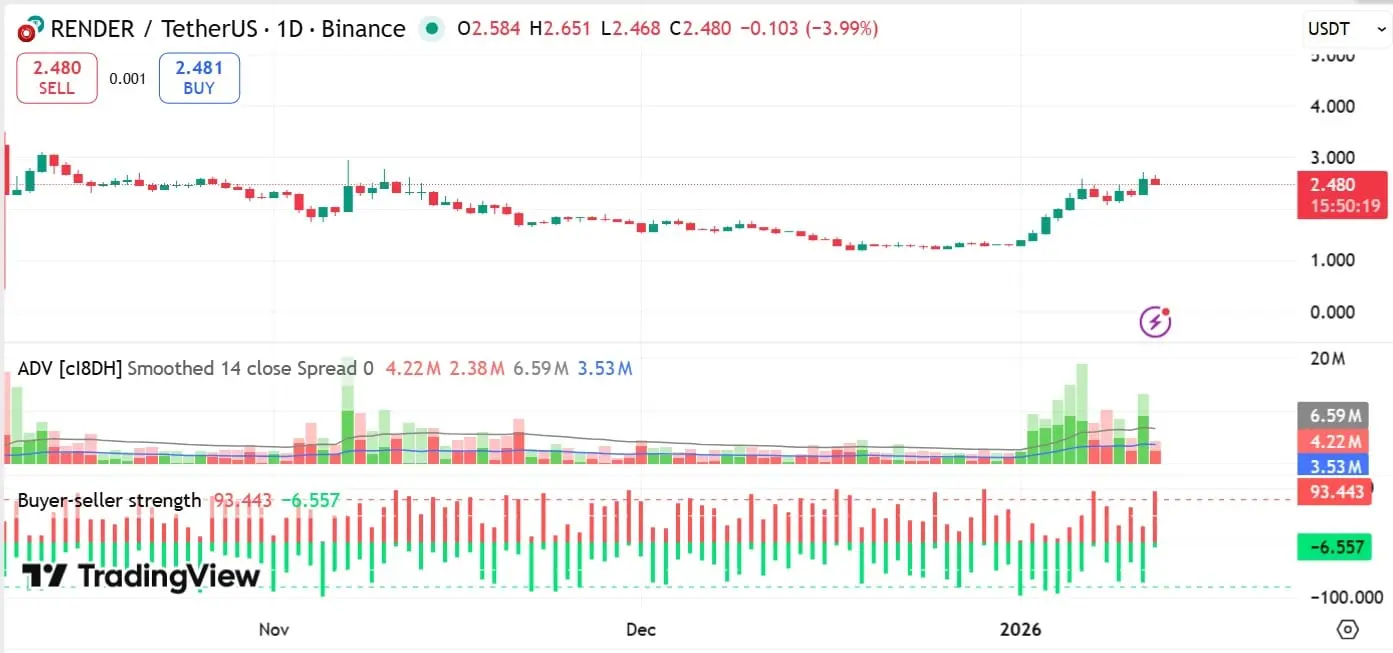 Source: TradingView Accordingly, accumulation volume increased to 13.16 million, while the Accumulation/Distribution index reached 8.88 million, indicating buyers are gaining dominance and reversing the previous distribution trend. On 1/12, accumulation momentum slowed somewhat with ADV decreasing to 4.22 million, but buying pressure remained on the market.
Observing the Buyer vs. Seller Strength indicator on TradingView, 1/11 recorded a surge in buyer strength to 70, while seller strength was only 29. By 1/12, sellers intensified, pushing the strength index up to 93, reflecting increasing profit-taking activity. Although buying still exists, the return of sellers could put downward pressure on the bullish trend.
Futures market remains optimistic
Interestingly, while the spot market showed signs of weakening after RENDER hit a two-month high, demand for futures positions increased significantly.
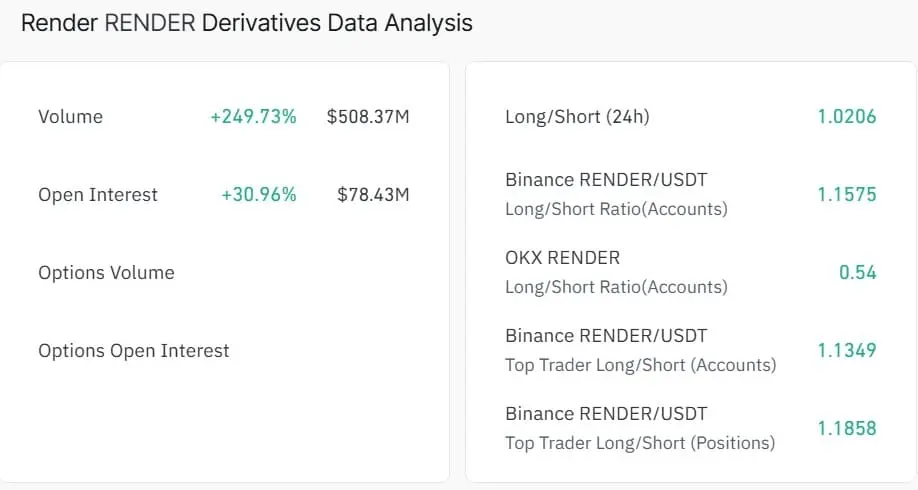
According to data from CoinGlass, derivatives trading volume surged 249% to $508 million, while open interest (OI) also increased by 30.96% to $78.43 million. The simultaneous rise in both OI and volume usually indicates increased market participation and more capital flowing into futures contracts.
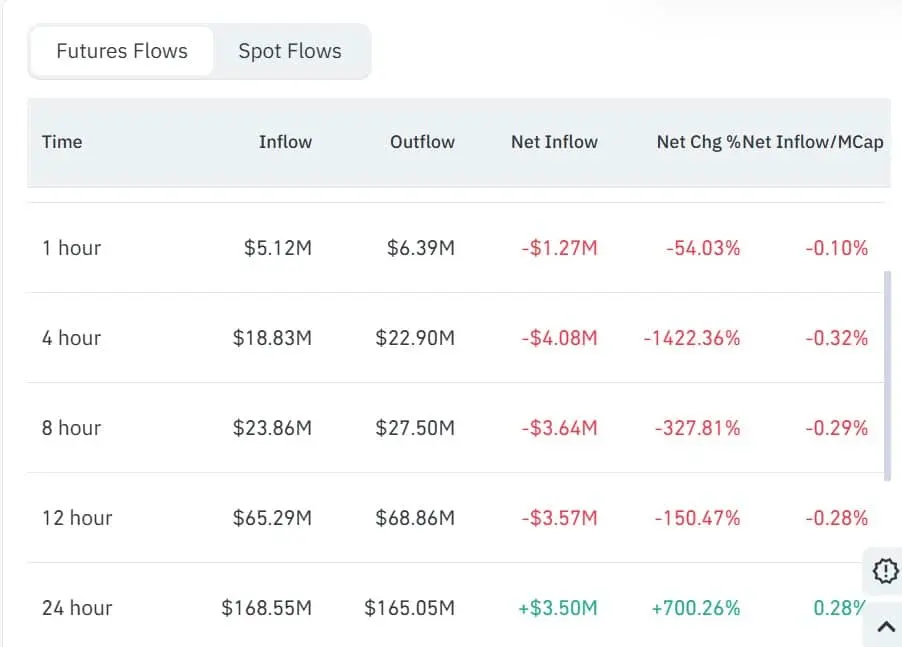
 Source: CoinGlass RENDER’s futures capital flow skyrocketed to $168.55 million, compared to $165.05 million outflow from futures. As a result, net capital in the futures market increased by 700.26% to $3.5 million, reflecting high demand for futures positions, whether long or short.
 Source: CoinGlass Notably, RENDER’s Long/Short ratio increased to 1.02, led by traders on Binance. This ratio above 1 indicates most traders expect the price to continue rising and favor long positions.
Perspective from momentum indicators
RENDER erased last week’s losses as buying pressure appeared across both spot and futures markets. However, profit-taking pressure from sellers also began to emerge, creating a tug-of-war between the two sides.
The RSI (Relative Strength Index) for RENDER decreased from 75 to 69, indicating increasing correction pressure, though still in the positive zone.
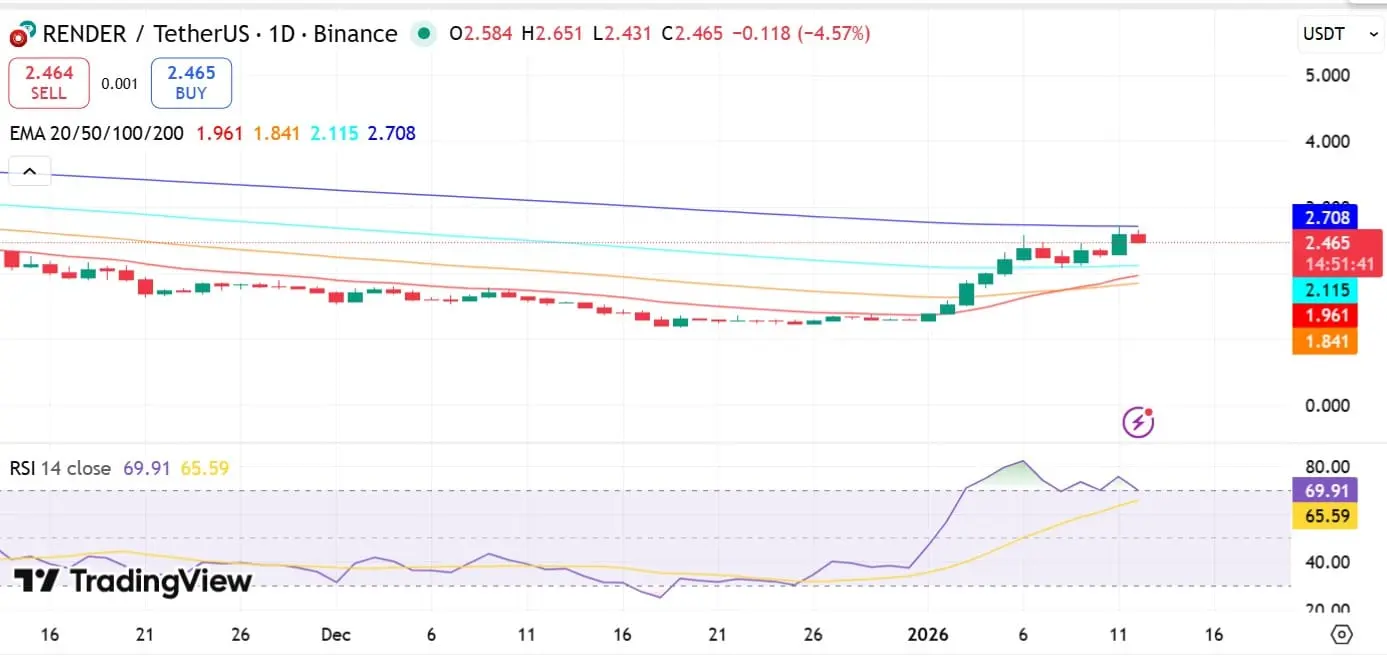 Source: TradingView Currently, the market balance depends on which side gains the upper hand in this struggle. If buying momentum continues and intensifies, RENDER could test the EMA200 at $2.7 and target resistance at $3.5. Conversely, if selling pressure increases and dominates, RENDER’s price risks falling back to $2.1.
Disclaimer: The information on this page may come from third parties and does not represent the views or opinions of Gate. The content displayed on this page is for reference only and does not constitute any financial, investment, or legal advice. Gate does not guarantee the accuracy or completeness of the information and shall not be liable for any losses arising from the use of this information. Virtual asset investments carry high risks and are subject to significant price volatility. You may lose all of your invested principal. Please fully understand the relevant risks and make prudent decisions based on your own financial situation and risk tolerance. For details, please refer to
Disclaimer.
Related Articles
TAO Price Pumps Another 20% as Bittensor Delivers What No Other AI Crypto Could
Bittensor's TAO token surged 20% today, achieving over 60% gains in the last month, following the completion of a groundbreaking decentralized language model. Market sentiments are high, signaling strong investor interest in Bittensor's technology.
CaptainAltcoin19m ago
BTC 15分钟下跌0.67%:宏观避险情绪与衍生品去杠杆共振放大卖压
2026年3月13日15:30至15:45(UTC),比特币(BTC)在71886.1至72602.0 USDT区间震荡,振幅0.99%,最终15分钟内下跌0.67%。该时段成交量较前一小时显著放大,多头仓位出现集中止损,短线波动引发市场高度关注,情绪维持极度谨慎。
本次异动的主要驱动力在于全球地缘政治局势紧张和通胀预期走高。美国与伊朗冲突升级导致布伦特原油价格维持在100美元/桶以上,市场对
GateNews33m ago
BTC 15分钟下跌1.06%:油价冲击与杠杆强平共振引发抛售压力
2026-03-13 14:30 至 14:45(UTC),BTC在15分钟内收益率录得-1.06%,K线价格区间为72933.4至73896.0 USDT,振幅达1.31%。短时间市场波动明显加剧,交易活跃度与关注度同步走高。
本次异动的主要驱动力是全球油价因美以对伊朗军事行动急飙至100美元上方,触发通胀预期升温和美联储降息可能性的下降,导致全球风险偏好大幅回撤。比特币作为流动性最强的风险
GateNews1h ago
Bitcoin Shows Value Bottom Signals but True Market Floor Missing
Bitcoin is at a "Value Bottom" ideal for long-term dollar-cost averaging, but has not yet reached a "Structural Bottom," leading to projected volatility between $60K-$70K. Investors should prepare for continued fluctuations and potential buying opportunities.
BlockChainReporter2h ago
Bitcoin Trades Narrow Range As Resistance Holds Near $71K
Bitcoin is trading around $70,335, showing a 2.13% decline in 24 hours. Analysts note a resistance near $71,400 and a consolidation phase, with traders awaiting a decisive breakout above or below established support and resistance levels.
CryptoBreaking2h ago
BTC 15-minute rise of 0.60%: ETF capital inflows and technical breakout resonance drive short-term momentum
2026-03-13 12:45 to 2026-03-13 13:00 (UTC), BTC achieved a +0.60% return within 15 minutes, with a price range of 72341.6-72888.0 USDT and a volatility amplitude of 0.76%. Short-term price oscillations noticeably intensified. Due to abundant trading volume, market attention rose rapidly, reflecting a phase of strengthened buying power.
The primary drivers of this movement are continuous net inflows into ETFs and a technical breakout of key structures. In March 2026, BTC spot ETFs attracted capital inflows as high as 1.6 billion dollars in a single week.
GateNews3h ago