
Key Highlights
-
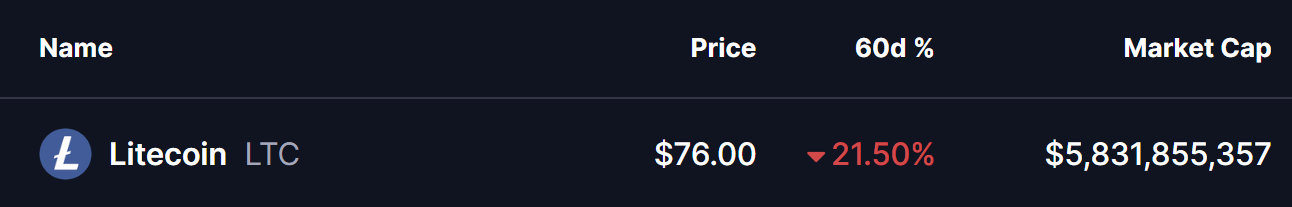
Litecoin (LTC) price has declined nearly 21% in the past 60 days, but its long-term structure remains intact.
-
Weekly and monthly charts show Litecoin closely mirroring Monero’s (XMR) historical bullish fractal.
-
Both LTC and XMR peaked in 2017 and 2021 and formed macro higher lows after the 2022 bear market bottom.
-
LTC is currently testing a long-term rising support trendline near the $75 region.
-
If the fractal continues to play out, Litecoin could be setting up for a larger upside move.
Litecoin (LTC) may have struggled in the short term, but zooming out tells a far more interesting story.
Over the past 60 days, LTC has slipped roughly 21%, reflecting broader market hesitation and declining momentum. However, beneath this pullback, Litecoin’s higher-timeframe structure is beginning to resemble Monero’s (XMR) long-term bullish setup—a fractal that has caught the attention of several analysts.
Source: Coinmarketcap
The comparison suggests that Litecoin could be quietly positioning itself for a larger move, similar to what Monero has already started to deliver.
Litecoin and Monero: A Fractal Years in the Making
According to a weekly chart shared by crypto analyst CryptoBullet, Litecoin’s structure closely mirrors Monero’s historical price behavior across multiple market cycles.
Both assets:
-
Peaked during the same periods in 2017 and again in 2021
-
Printed slightly higher highs during the 2021 cycle
-
Formed macro higher lows following the 2022 bear market bottom
This is a critical observation. Since the 2022 lows, Litecoin has displayed relative strength, maintaining a structure that aligns almost step-by-step with XMR’s longer-term bullish path. Monero has already begun breaking higher from this formation, which raises the question: Is Litecoin simply lagging behind?
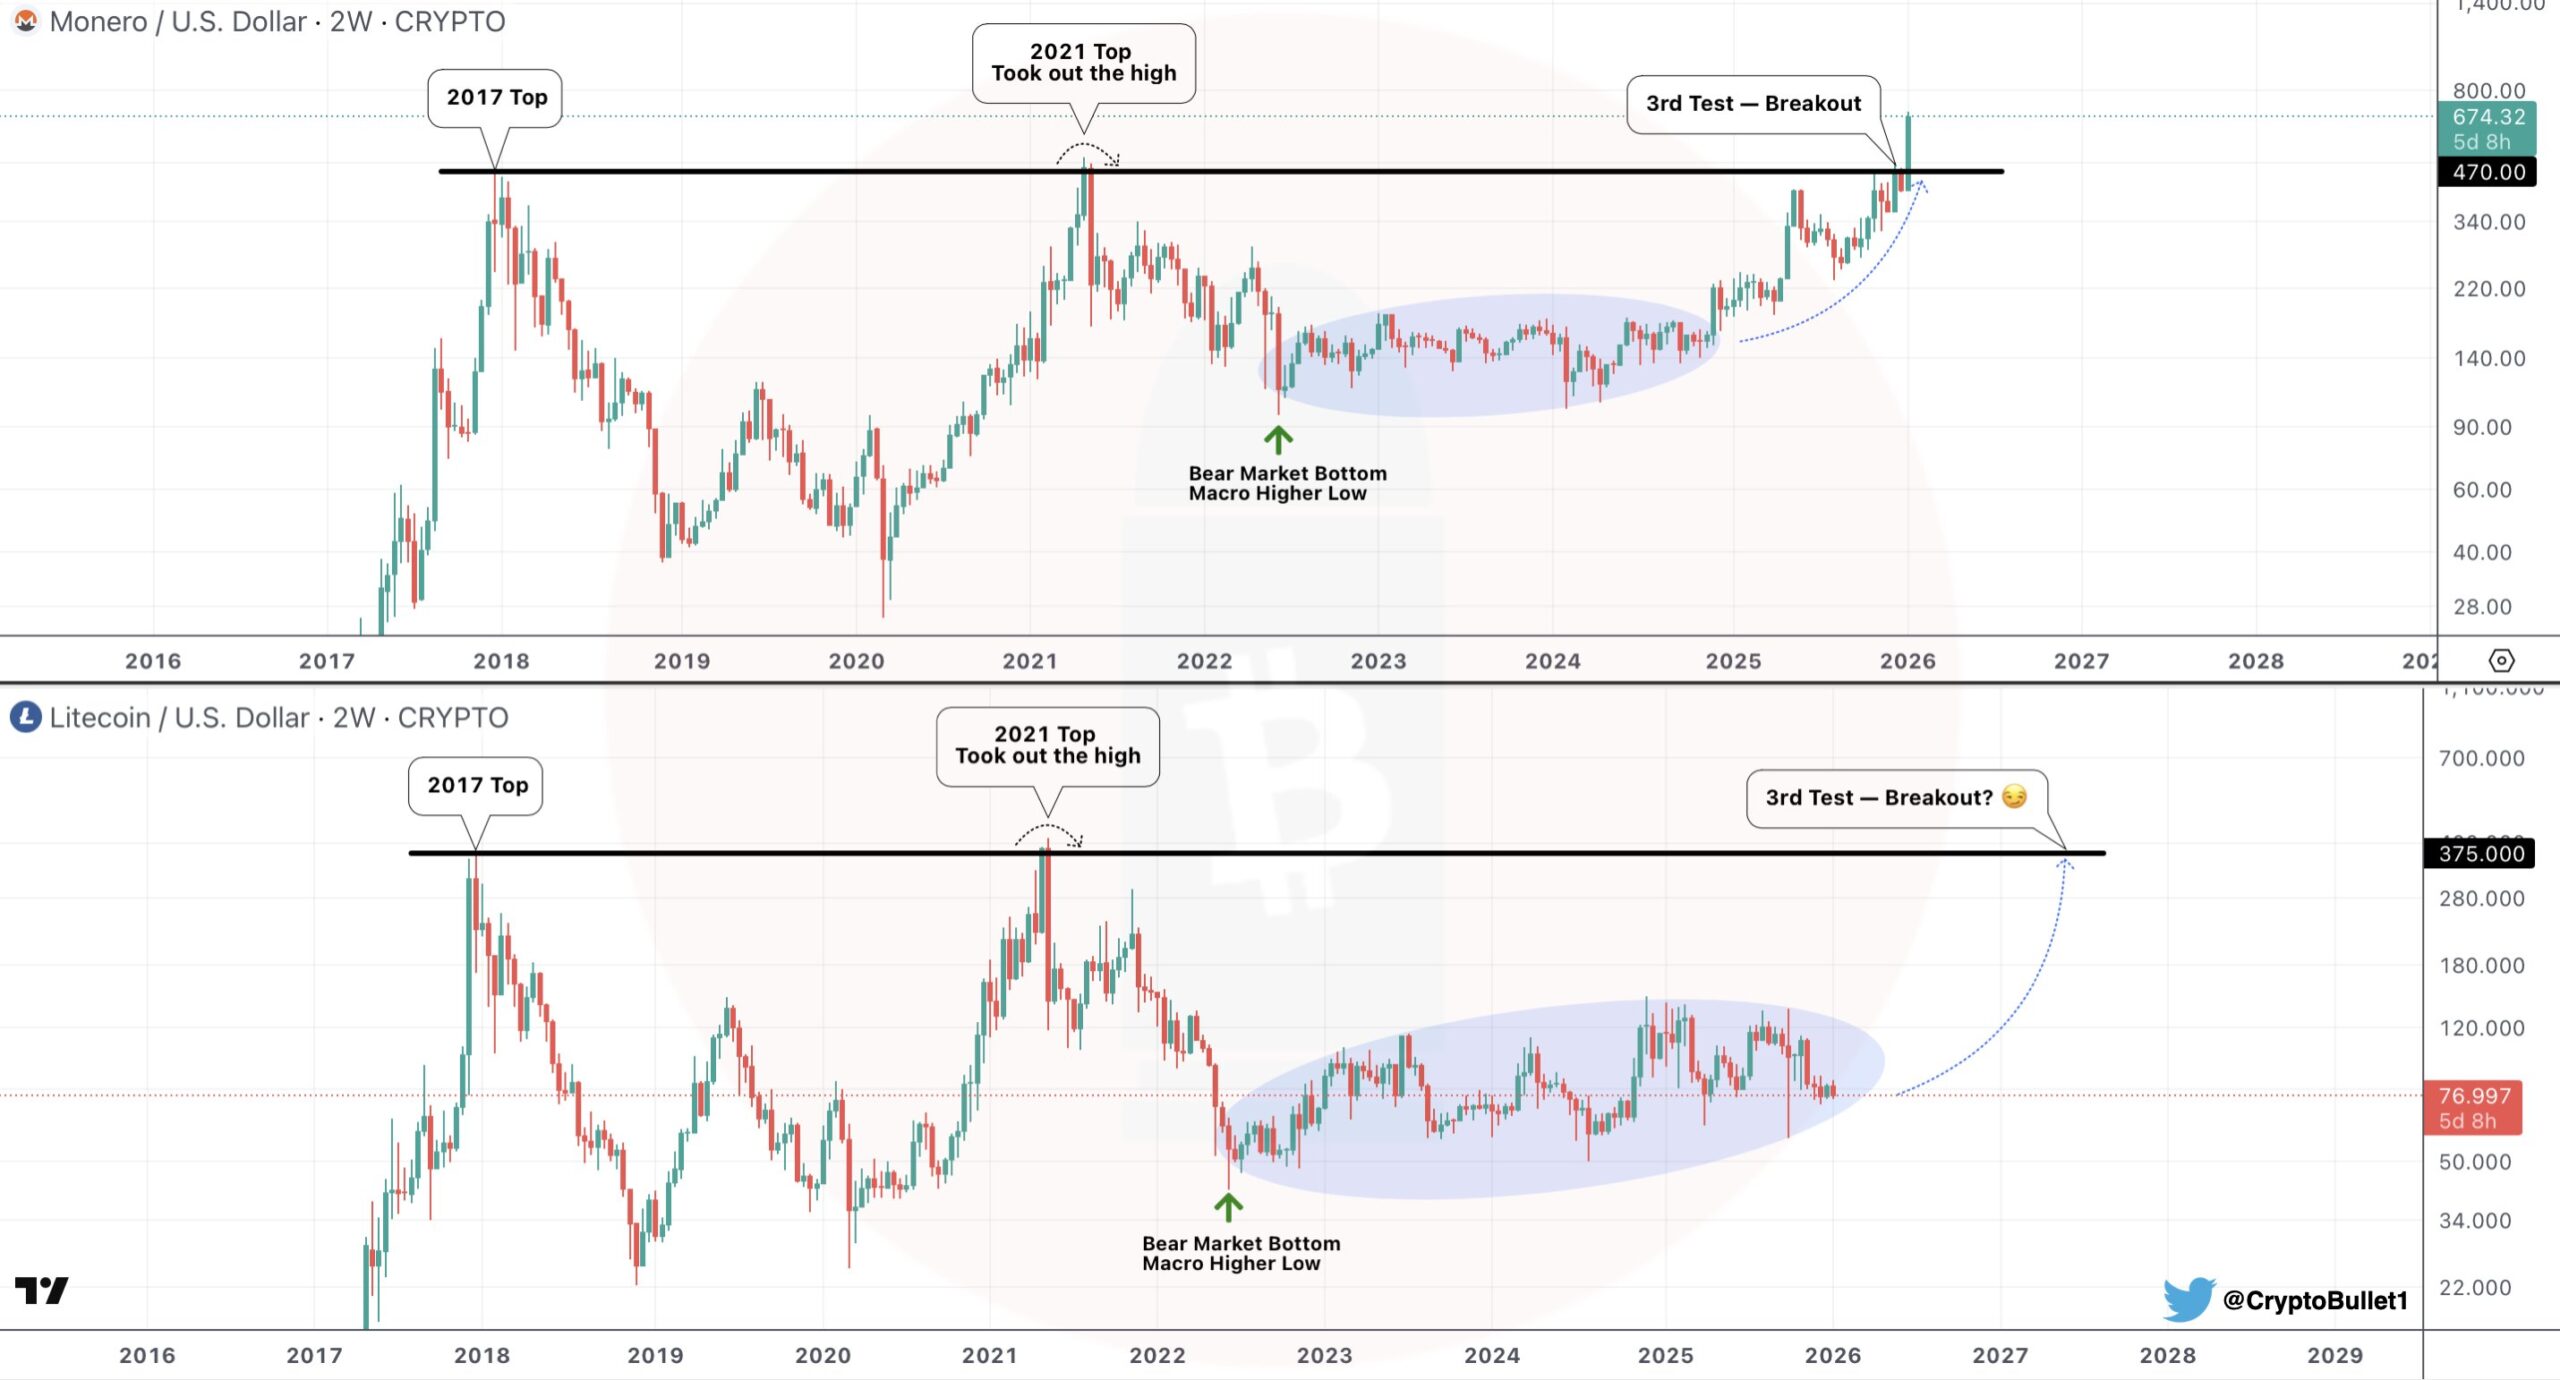
XMR and LTC Weekly Fractal Chart/Credits: @CryptoBullet1 (X)
Fractal patterns like these don’t guarantee identical outcomes, but they often highlight market psychology, especially when two assets have matured through multiple cycles.
Monthly Chart Signals: Long-Term Support in Focus
On the monthly timeframe, analyst @_CryptoSurf highlights another important similarity.
Litecoin is currently testing its long-term rising support trendline near the $75 region, the same structural zone that historically marked accumulation phases during prior cycles. This mirrors Monero’s own behavior before its recent upside expansion.
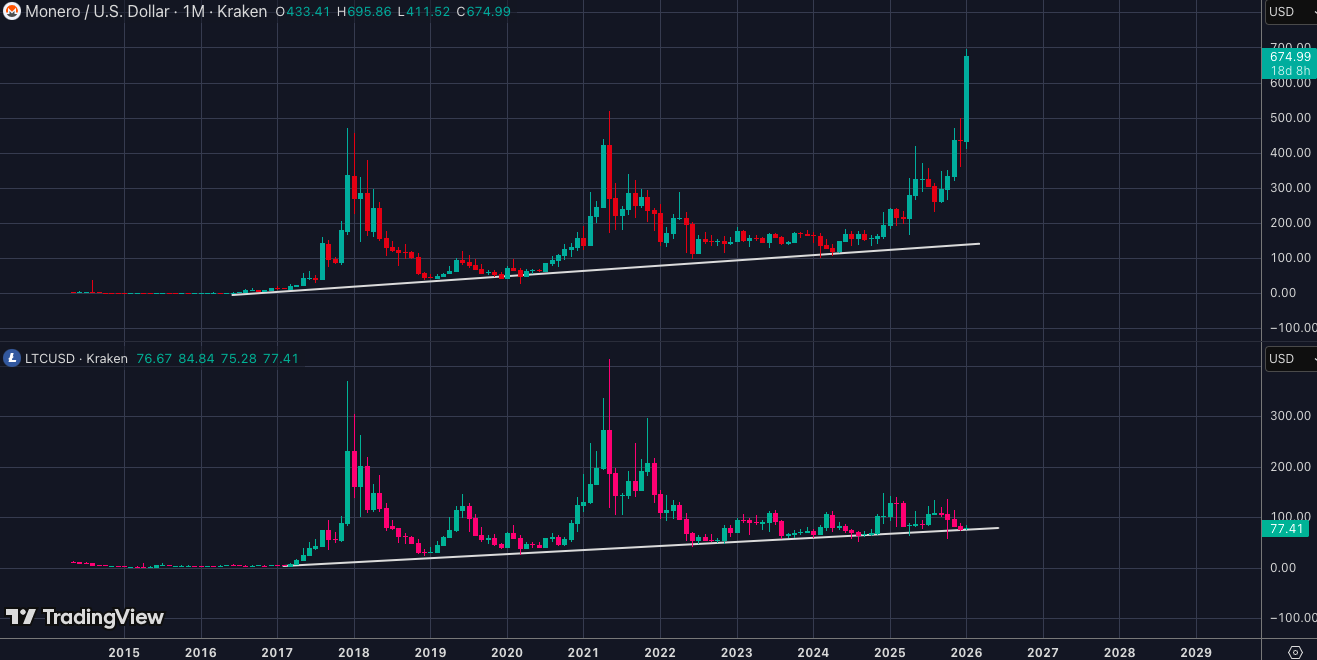
_XMR and LTC Monthly Fractal Chart/Credits: @CryptoSurf (X)
As long as this trendline holds, Litecoin’s broader structure remains intact. Prolonged consolidation at macro support often precedes volatility expansion, particularly when supply pressure dries up after extended drawdowns.
What Could Come Next for Litecoin (LTC)?
If the fractal comparison continues to play out, Litecoin may be approaching the later stages of its base formation.
Monero’s breakout followed:
For Litecoin, a similar roadmap would imply that the current consolidation phase could be a prelude to an upside rally, rather than a sign of weakness. The upper long-term trendline—currently far above price—stands out as the next major technical magnet if bullish momentum returns.
That said, structural support around $75 remains critical. Losing this level would weaken the fractal comparison and delay any bullish scenario.
Bottom Line
Despite recent downside pressure, Litecoin’s higher-timeframe structure suggests the correction may be part of a broader accumulation phase. The strong fractal similarity with Monero’s bullish path indicates that LTC could be lagging rather than weakening. As long as the $75 macro support holds, Litecoin may be positioning itself for a potential breakout in the coming cycle.
Frequently Asked Questions (FAQ)
Is Litecoin following Monero’s bullish price pattern?
Yes, Litecoin’s weekly and monthly charts show a strong fractal similarity to Monero, including shared cycle highs in 2017 and 2021 and a macro higher low formed after the 2022 bear market.
Why is the $75 level important for Litecoin?
The $75 region aligns with Litecoin’s long-term rising support trendline. Holding this level keeps the bullish higher-timeframe structure intact.
Disclaimer: The views and analysis presented in this article are for informational purposes only and reflect the author’s perspective, not financial advice. Technical patterns and indicators discussed are subject to market volatility and may or may not yield the anticipated results. Investors are advised to exercise caution, conduct independent research, and make decisions aligned with their individual risk tolerance.
About Author: Nilesh Hembade is the Founder and Lead Author of Coinsprobe, with over 5 years of experience in the cryptocurrency and blockchain industry. Since launching Coinsprobe in 2023, he has been providing daily, research-driven insights through in-depth market analysis, on-chain data, and technical research.
Disclaimer: The information on this page may come from third parties and does not represent the views or opinions of Gate. The content displayed on this page is for reference only and does not constitute any financial, investment, or legal advice. Gate does not guarantee the accuracy or completeness of the information and shall not be liable for any losses arising from the use of this information. Virtual asset investments carry high risks and are subject to significant price volatility. You may lose all of your invested principal. Please fully understand the relevant risks and make prudent decisions based on your own financial situation and risk tolerance. For details, please refer to
Disclaimer.
Related Articles
The United States releases 172 million barrels of strategic oil! Iran warns oil prices could rise to $200
The U.S. Secretary of Energy announced plans to coordinate the release of 400 million barrels of oil to counter Iran's threats, with the release of 172 million barrels being the largest in history. Market reactions to this move are uncertain, and oil prices remain affected by the security situation in the Strait of Hormuz. At the same time, oil price fluctuations will impact the Bitcoin market, potentially increasing inflationary pressures and limiting liquidity. The United States plans to replenish the released oil within a year, which should not have a long-term impact on energy security.
MarketWhisper5m ago
Crude oil and gold volatility indices hit new highs in 2021, with bullish sentiment dominating the crypto options market.
On March 12th, Gate Research Institute noted that the volatility of traditional assets such as gold and crude oil reached new highs, at 33% and 108% respectively. In the crypto assets sector, the implied volatility of BTC and ETH is also high. Recently, the market has been dominated by put options, but the demand for hedging has weakened, and short-term price fluctuations may be influenced by Gamma effects. Gate has also launched gold and crude oil options, marking the first introduction of traditional assets.
GateNews9m ago
21Shares Analyst: BTC May Fluctuate Between $68,000 and $74,000 in the Short Term
21Shares strategist Matt Mena pointed out that March CPI data has been absorbed by the market. In the short term, BTC is expected to fluctuate between $68,000 and $74,000. After breaking above $75,000, it may enter the $75,000 to $80,000 range. Historically, BTC often rebounds more than 15% after geopolitical shocks, and a restart of rate cuts could accelerate the recovery.
GateNews52m ago
10x Research: Model triggered the most altcoin buy signals since October last year
Gate News Report, March 12 — Market analysis firm 10x Research stated on the X platform that its model has triggered the most altcoin buy signals since October of last year. Although the overall sentiment in the crypto market remains weak and trading volume is near lows, the technical momentum of some altcoins is improving and aligns with fundamental catalysts.
GateNews1h ago
Analyst: Bitcoin's current support level is $62,791, and resistance level is $71,840.
Gate News Report, March 12, According to analyst @alicharts, Bitcoin's current support level is at $62,791, and resistance is at $71,840. The analyst stated that only a clear breakout in either direction can determine the next trend.
GateNews1h ago
Why did Bitcoin rise today? CPI met expectations, and the Federal Reserve confirmed no change in policy
The US February Consumer Price Index met expectations, prompting Bitcoin prices to rebound to around $70,000. The CPI report reduced market uncertainty regarding the Federal Reserve's interest rate decisions, which is favorable for risk assets. Despite global market pressures, Bitcoin continues to benefit from short-term sentiment improvement, but rising energy prices could reignite inflation and impact liquidity. $72,000 is an important resistance level for Bitcoin; a breakthrough is needed for further upward movement.
MarketWhisper1h ago