
Prominent analyst Ardi summed it up well. Once DASH lost the $71 level, a pullback was almost guaranteed. And that is exactly what played out. The DASH price slid lower and is now sitting in the low-to-mid $60s, following a very textbook correction after a strong rally.
What makes this move interesting is how controlled it looks. After pushing hard to the upside and printing a sharp local top, DASH didn’t collapse. Instead, it stepped down slowly, forming what looks more like a reset than a breakdown.
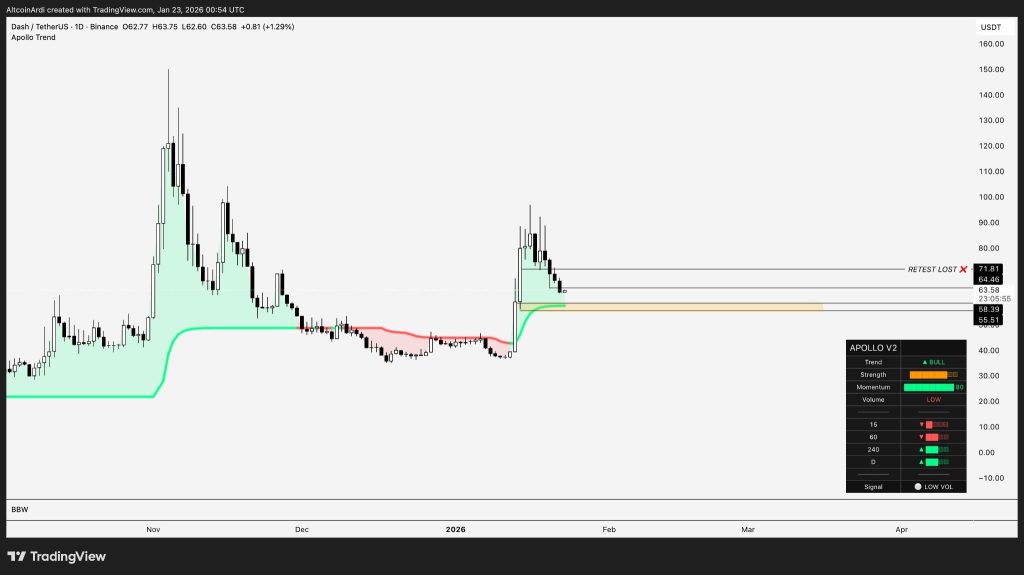
The area around $71.81 now stands out as the key level that failed to hold. If buyers had managed to reclaim it, the move could have turned into a full continuation. Since that did not happen, the market shifted into a cooling phase instead.
- Why The DASH Pullback To This Level Matters
- The Real Test For DASH Sits In The Current Support Zone
- What’s Next for DASH?
Why The DASH Pullback To This Level Matters
One of the first stops on the way down was around $64. Ardi pointed out that the market was likely to sweep that wick, and the chart confirms it.
Source: X/@ArdiNSC
The DASH price dipped just below the $64.46 level, which is a classic behavior after fast upside moves. Price often revisits these zones to clear out late buyers and reset positioning.
This is usually where opinions split. Some traders see this area as a decent short-term dip opportunity, while others stay patient and wait for deeper levels. With volume currently low, both approaches make sense depending on the time frame.
The Real Test For DASH Sits In The Current Support Zone
The most important zone right now is clearly the liquidity pocket between $55 and $58. That range is marked on the chart for a reason. If the DASH price continues to slide, this is the area where buyers really need to step in.
This zone also defines whether the structure remains bullish. As long as DASH holds above it, the broader uptrend technically stays intact.
The Apollo Trend indicator still shows a bullish trend with strong momentum, but the low volume reading hints that the market is waiting for fresh participation before making its next big move.
Why Is Sentient (SENT) Price Pumping Right Now?_**
What’s Next for DASH?
If the DASH price fails to hold the $55–$58 area, the picture changes quickly. At that point, the move stops looking like a healthy correction and starts to resemble a deeper retracement.
That is where Ardi’s comment about ~$45 becoming a “magnet” comes into play, since that area acted as the base before the last breakout.
For now, DASH is simply catching its breath. It is not breaking structure yet. The next move is pretty clear: either it finds support in the $55–$58 zone and stabilizes, or it slips lower and opens the door for a move toward $45.
Disclaimer: The information on this page may come from third parties and does not represent the views or opinions of Gate. The content displayed on this page is for reference only and does not constitute any financial, investment, or legal advice. Gate does not guarantee the accuracy or completeness of the information and shall not be liable for any losses arising from the use of this information. Virtual asset investments carry high risks and are subject to significant price volatility. You may lose all of your invested principal. Please fully understand the relevant risks and make prudent decisions based on your own financial situation and risk tolerance. For details, please refer to
Disclaimer.
Related Articles
ADA Price Outlook as Cardano Lands LSE Tokenized Deal
Key Insights
Cardano tokenized a Hannover Re reinsurance product and listed it on the London Stock Exchange, expanding blockchain use in regulated institutional markets.
ADA price holds within a descending wedge as support at $0.2400 remains intact while resistance near $0.2550 and $0.2824 l
CryptoNewsLand2h ago
SUI Price Eyes $1.10 Breakout as Whale Positions Rise
Key Insights
SUI trades at $0.96 with RSI at 53.66, showing neutral momentum while maintaining upside room for expansion toward resistance levels.
Whale positioning at 70% long signals strong institutional confidence, aligning with rising open interest and steady capital inflows despite
CryptoNewsLand2h ago
Shiba Inu Open Interest Surges 13.45% in 24 Hours as Futures Activity Accelerates
SHIB open interest rose 13.45% to $69.79M with price up ~3% to $0.000006231. Futures inflows higher; volumes surged. Technicals show 50-day MA support, RSI 55, MACD bullish; potential move beyond 0.000010.
Abstract: This report reviews SHIB market activity on Gate News as of April 22. SHIB open interest rose 13.45% to $69.79 million, with the price up about 3% to $0.000006231. Futures inflows exceeded outflows and total volumes rose, while spot and futures taker data showed mixed biases. Technically SHIB found support near the 50-day MA, RSI sits at 55, and the MACD turned positive, signaling a potential breakout and a possible rally beyond the $0.000010 level after a confirmed channel breakout.
GateNews2h ago
Shiba Inu Breakout Gains Strength as Volume Surges
Key Insights
Shiba Inu’s breakout above the triangle pattern gains strength as rising volume and higher lows confirm growing demand and a sustained bullish market structure shift.
Derivatives activity jumps significantly with volume surpassing $249 million while open interest rises,
CryptoNewsLand3h ago
XRP Price Near $1.45 as ETF Inflows Build Pressure
Key Insights
Institutional XRP ETF inflows reached $41.6 million over four days, lifting assets under management above $1.08 billion and strengthening market confidence.
XRP faces strong resistance near $1.45, where CoinGlass data highlights a short max
CryptoNewsLand3h ago
PENGU Eyes $0.009 as Open Interest Surge Signals Breakout
Key Insights
PENGU’s tightening Bollinger Bands and neutral RSI show controlled accumulation, indicating momentum buildup that typically precedes significant price expansion in volatile markets.
Open interest climbed despite falling prices, reflecting new capital entering positions and
CryptoNewsLand3h ago