The US Dollar Index repeats the 2017 crash! Will Bitcoin experience a surge again?
The US Dollar Index fell below 96 this week, hitting a four-year low since February 2022, and broke below a key trendline that has supported the dollar for 15 years since 2011. President Trump downplayed the decline, stating “The dollar is doing very well,” which was followed by the DXY recording its largest single-day drop since April. Historical data shows that after the dollar broke 96 in 2017 and 2020, Bitcoin experienced explosive rallies, with technical RSI showing bullish divergence and expected rebound to $95,000.
The Historical Significance of the Dollar Index Losing the 15-Year Trendline
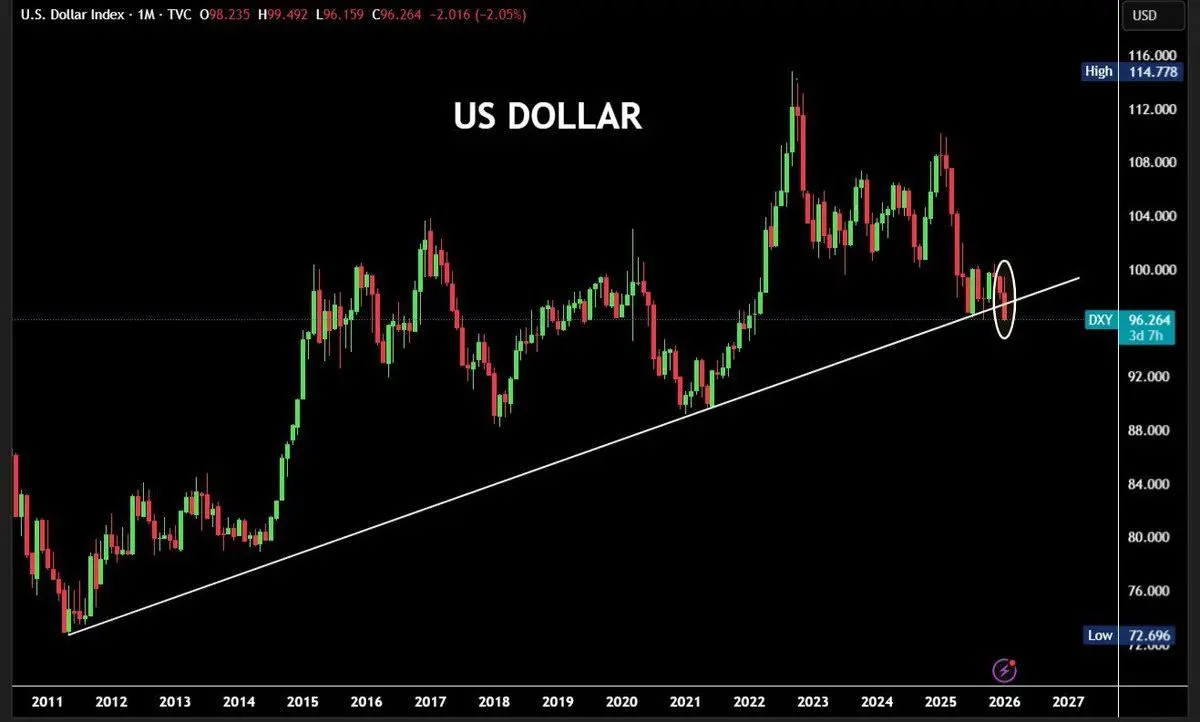
(Source: Trading View)
The dollar index has fallen below 96 for the first time since early 2022, a level of technical importance far beyond a typical support level. From the monthly chart, 96 has long been the support level for dollar strength since 2011, representing a 15-year trendline. This trendline has witnessed the dollar’s recovery after the global financial crisis, safe-haven inflows during the European debt crisis, and a strong rebound after the COVID-19 pandemic. When this 15-year support is effectively broken, its technical significance is comparable to a “century trendline” breakout in the stock market.
Market data shows that the dollar index once dropped to 95.5, the lowest since February 2022, before settling back around 96 at the time of writing. This price action indicates that the 96 level is shifting from support to resistance. If the index cannot regain and hold above 96 in the coming days, it will confirm a trend reversal technically, and the dollar could enter a longer-term downtrend.
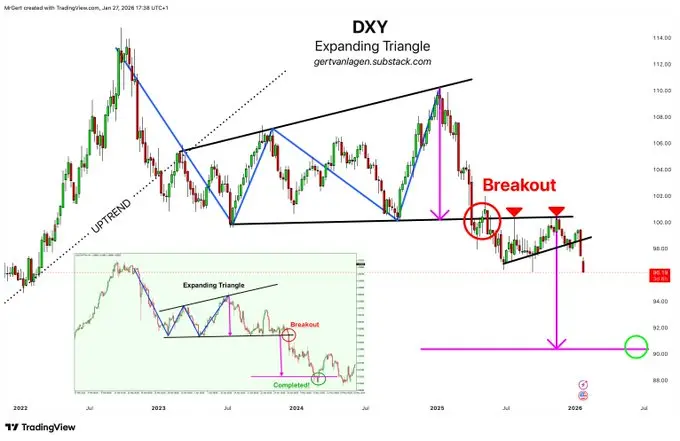
(Source: Trading View)
The next three days are critical. If the monthly closing price falls below the 15-year trendline, technical analysts expect the dollar to weaken further, with the next support possibly in the 93-94 range. Conversely, if the monthly close can re-establish above the trendline, this break may be a false breakout, and the dollar could test the 98-100 zone again. Historically, trendline breaks often require time to confirm; a single day or week’s breach is insufficient to draw conclusions. The monthly closing price remains the definitive factor.
Key Technical Levels for the Dollar Index
Current Level: Around 96
Four-year low: 95.5 (lowest since February 2022)
15-year trendline: Support since 2011, now broken
Next support: 93-94 zone
Key confirmation: Monthly close below 96 confirms trend reversal
Recent macroeconomic developments continue to pressure the dollar index. Market speculation about possible intervention by Japan to weaken the yen has driven the yen higher and pressured the dollar. The Bank of Japan governor recently hinted at multiple rate hikes to reach a higher neutral rate, changing the expectations of the US-Japan interest rate differential. When the interest gap narrows, arbitrage trades borrowing yen to invest in dollar assets become less profitable, leading to capital flowing back into Japan, pushing up the yen and lowering the dollar.
Meanwhile, the International Monetary Fund (IMF)’s warnings about global financial stability have also attracted market attention. According to European economic news site Euractiv, IMF Chief Kristalina Georgieva stated in Brussels that the fund is strengthening its simulations of “unimaginable events” and developing policy responses. When asked whether this includes potential dollar asset devaluations, she said the IMF is conducting “various scenarios” in its analysis. Such warnings from an international financial authority have heightened concerns about the dollar’s long-term position.
Trump’s “Dollar is Doing Very Well” Remarks Trigger Selloff
The most damaging blow to the dollar index came from President Trump’s public statement. During a speech to reporters in Iowa, he downplayed the recent decline of the dollar, saying “No, I think it’s very good… I think the dollar’s value, just look at the business we’re doing. The dollar is very strong.” At the time of this statement, the dollar index was experiencing its largest four-day decline since market volatility caused by tariffs in April last year.
Trump’s remarks were interpreted by markets as tacit approval or even encouragement of a weaker dollar by the US government. Historically, US presidents rarely publicly discuss exchange rate policies, as these are typically within the purview of the Treasury and Federal Reserve. When Trump explicitly said “the dollar is very strong,” the market understood that he was not planning to take measures to support the dollar and might even welcome a decline to boost US exports.
Trump also hinted that he “could make the dollar go up and down like a yo-yo,” while criticizing some Asian economies for trying to devalue their currencies to gain competitive advantage. He specifically mentioned: “If you look at China and Japan, I fought them hard because they always want to devalue their currencies… Yen, Renminbi, they always want to devalue, devalue, and devalue.” This suggests the US might enter a “weak dollar” policy cycle to counteract other countries’ currency devaluation strategies.
Following these comments, the dollar index plummeted in a single day. Forex traders quickly adjusted positions, selling dollars and buying yen, euros, and other major currencies. The dollar’s weakness triggered a chain reaction in global financial markets, boosting dollar-denominated assets including gold, commodities, and Bitcoin.
History Shows Bitcoin Initiates Bull Market After Dollar Breaks 96
The inverse relationship between the dollar and Bitcoin has been well established. Current trends show that historically, when the dollar index falls below 96, it often signals a major rally in Bitcoin. Analysts point out that the last two times this occurred (in 2017 and 2020), Bitcoin experienced explosive growth afterward.
The 2017 scenario is particularly classic. After the dollar index broke below 96, it continued weakening, reaching a low near 88. During the same period, Bitcoin launched an epic bull run from around $2,000, soaring to nearly $20,000 by year-end, a 10-fold increase. This synchronicity is not coincidental but reflects a pattern where global capital seeks alternative stores of value when the dollar weakens.
Similarly, in 2020, following the COVID-19 outbreak, the Fed launched unlimited quantitative easing, causing the dollar index to fall below 96 from high levels. Subsequently, from 2020 to 2021, Bitcoin surged from around $10,000 to a record high of $69,000, nearly a 7-fold increase. These historical precedents provide a key reference: when the dollar index breaches the 96 psychological threshold, Bitcoin often enters a major upward cycle.
The underlying logic is straightforward. Dollar weakness usually accompanies concerns over declining fiat currency purchasing power, prompting investors to seek non-government-controlled stores of value. Bitcoin, as “digital gold,” with a fixed supply cap of 21 million coins, is an ideal hedge against dollar devaluation. When the dollar weakens, Bitcoin priced in dollars naturally rises, reinforcing this inverse relationship through fundamental value transfer.
Additionally, recent technical analysis highlights bullish signals for Bitcoin. Bitcoin Vector notes that Bitcoin’s price and the Relative Strength Index (RSI) are forming bullish divergence. This pattern occurs when the price makes new lows but RSI does not, often indicating waning selling pressure and a potential trend reversal.
Based on this analysis, similar setups and timeframes previously yielded about 10% gains, suggesting Bitcoin could rebound toward $95,000. The analysis emphasizes: “The real signal lies in the convergence: if we see on-chain fundamentals and liquidity both increasing while Bitcoin’s dominance remains stable, we are likely at the start of a major bull reversal.”
Can Bitcoin Repeat the 2017 and 2020 Rallies?
While historical data supports the bullish case for Bitcoin, some analysts remain cautious. The current market environment differs from 2017 and 2020 in key ways. First, Bitcoin’s market cap has grown from hundreds of billions to trillions of dollars, requiring larger capital inflows to achieve similar percentage gains. Second, the regulatory landscape has fundamentally changed; the introduction of spot ETFs in 2024 has brought institutional capital but also increased correlation with traditional financial markets, potentially weakening Bitcoin’s role as an independent safe haven.
Furthermore, the complex macro environment adds uncertainty. Geopolitical tensions, inflation concerns, divergent central bank policies, and trade tensions create a more unpredictable market. While dollar weakness is a positive factor, if it coincides with global recession fears or financial instability, risk assets including Bitcoin could face selling pressure rather than benefiting from capital shifts.
Whether the current market setup can translate into a new Bitcoin bull run depends on the coming weeks’ trends in forex markets and broader risk assets. Investors should closely monitor the monthly close of the dollar index, capital flows into Bitcoin ETFs, and on-chain activity metrics. Only when these factors align positively can we confirm that Bitcoin is replicating the 2017 and 2020 bull market patterns.
Related Articles
ETH 15-minute increase of 1.09%: Whales' on-chain buying and ETF capital inflows drive price rebound
Wintermute Analyst: Capital has begun a phased shift towards cryptocurrencies, and BTC outperforming US stocks may be due to capital rotation
BTC short-term rises by 1.35%: Technical breakthroughs and short covering drive price surge
ETH short-term increase reaches 2.38%: Macroeconomic safe-haven capital inflows and ETF institutional funds resonate to drive prices higher
BARD Skyrockets 61.7% As Looming Breakout Sets to Make Lombard Holders Richer: Analyst