
The charts are lining up around an important moment for the ZEC price. After weeks of sideways and choppy action, Zcash is now sitting at a level that could either support a rebound or lead to another move lower.
On the lower-timeframe chart, the ZEC price is hovering around the $360–$370 area, a zone that has acted as a pivot multiple times. This is where traders are watching closely to see if a higher low can form. Holding this range keeps the recovery structure in place, while losing it would shift attention back toward lower support zones.
- Zcash Short-Term Levels That Matter Most
- The ZEC Daily Chart Shows the Bigger Picture
- What to Watch Next for the ZEC Price
Zcash Short-Term Levels That Matter Most
The 4-hour chart shared by Sjuul gives a clean roadmap. Support sits around $360–$370, which is where the ZEC price is currently trying to hold its ground. Above that, the next major hurdle comes in near $460, a level that has capped rallies in the past.
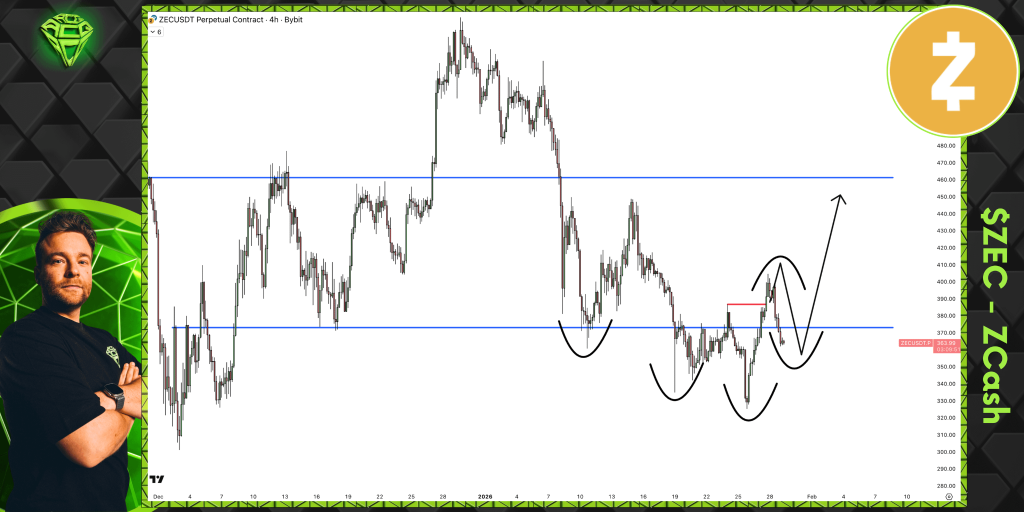
Source: X/@AltCryptoGems
There is also a clear invalidation level on the chart. A breakdown below $320 would invalidate the higher-low idea and shift the structure back toward a more bearish setup. That does not mean price is headed there, but it is the line that separates recovery from failure.
For the bullish scenario to materialize, ZEC needs to recover $370 and follow through. If so, a move to the high $300s and then testing the $460 resistance level is not entirely far-fetched.
The ZEC Daily Chart Shows the Bigger Picture
Zooming out to the daily chart shared by BitcoinCensus changes the perspective. The Zcash price has been trading within a wide bullish flag-like formation over the past months after a strong rally in the earlier stages of the cycle. The price is still trading within the flag formation. Therefore, it is likely to experience some minor corrections.
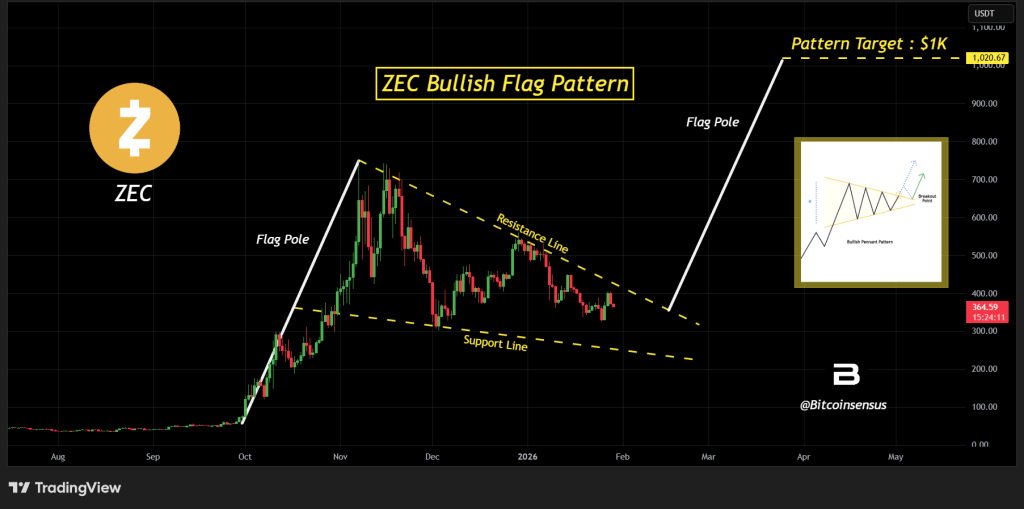
Source: X/@Bitcoinsensus
The long-term projection from this pattern points toward $1,000, but that is clearly a macro target, and not something expected in the near term.
For that scenario to even come into play, the ZEC price would need to reclaim several major resistance zones and eventually break out of the larger structure with momentum.
$KAS Price Prediction – $5,000 in Kaspa Now, How Much Could It Be Worth by 2027?_**
What to Watch Next for the ZEC Price
The big question in the short term is whether ZEC can continue to trade above the $360 to $370 level and keep the level around $320 at bay.
If that level continues to hold, the charts do indicate that ZEC could move back up towards the $400 level, perhaps facing resistance at the $460 level in the process.
Disclaimer: The information on this page may come from third parties and does not represent the views or opinions of Gate. The content displayed on this page is for reference only and does not constitute any financial, investment, or legal advice. Gate does not guarantee the accuracy or completeness of the information and shall not be liable for any losses arising from the use of this information. Virtual asset investments carry high risks and are subject to significant price volatility. You may lose all of your invested principal. Please fully understand the relevant risks and make prudent decisions based on your own financial situation and risk tolerance. For details, please refer to
Disclaimer.
Related Articles
The United States releases 172 million barrels of strategic oil! Iran warns oil prices could rise to $200
The U.S. Secretary of Energy announced plans to coordinate the release of 400 million barrels of oil to counter Iran's threats, with the release of 172 million barrels being the largest in history. Market reactions to this move are uncertain, and oil prices remain affected by the security situation in the Strait of Hormuz. At the same time, oil price fluctuations will impact the Bitcoin market, potentially increasing inflationary pressures and limiting liquidity. The United States plans to replenish the released oil within a year, which should not have a long-term impact on energy security.
MarketWhisper5m ago
Crude oil and gold volatility indices hit new highs in 2021, with bullish sentiment dominating the crypto options market.
On March 12th, Gate Research Institute noted that the volatility of traditional assets such as gold and crude oil reached new highs, at 33% and 108% respectively. In the crypto assets sector, the implied volatility of BTC and ETH is also high. Recently, the market has been dominated by put options, but the demand for hedging has weakened, and short-term price fluctuations may be influenced by Gamma effects. Gate has also launched gold and crude oil options, marking the first introduction of traditional assets.
GateNews9m ago
21Shares Analyst: BTC May Fluctuate Between $68,000 and $74,000 in the Short Term
21Shares strategist Matt Mena pointed out that March CPI data has been absorbed by the market. In the short term, BTC is expected to fluctuate between $68,000 and $74,000. After breaking above $75,000, it may enter the $75,000 to $80,000 range. Historically, BTC often rebounds more than 15% after geopolitical shocks, and a restart of rate cuts could accelerate the recovery.
GateNews51m ago
10x Research: Model triggered the most altcoin buy signals since October last year
Gate News Report, March 12 — Market analysis firm 10x Research stated on the X platform that its model has triggered the most altcoin buy signals since October of last year. Although the overall sentiment in the crypto market remains weak and trading volume is near lows, the technical momentum of some altcoins is improving and aligns with fundamental catalysts.
GateNews1h ago
Analyst: Bitcoin's current support level is $62,791, and resistance level is $71,840.
Gate News Report, March 12, According to analyst @alicharts, Bitcoin's current support level is at $62,791, and resistance is at $71,840. The analyst stated that only a clear breakout in either direction can determine the next trend.
GateNews1h ago
Why did Bitcoin rise today? CPI met expectations, and the Federal Reserve confirmed no change in policy
The US February Consumer Price Index met expectations, prompting Bitcoin prices to rebound to around $70,000. The CPI report reduced market uncertainty regarding the Federal Reserve's interest rate decisions, which is favorable for risk assets. Despite global market pressures, Bitcoin continues to benefit from short-term sentiment improvement, but rising energy prices could reignite inflation and impact liquidity. $72,000 is an important resistance level for Bitcoin; a breakthrough is needed for further upward movement.
MarketWhisper1h ago