The simultaneous strengthening of the three indicators is changing the market’s logic for pricing the Fed’s policy path.
Based on the latest data from CME FedWatch on July 24, the probability that the Fed will hold rates steady at the July meeting is 64.2%, while the probability of cumulative 25 bps of rate hikes is 35.8%. While holding steady remains the base case, the 35.8% rate-hike probability is far higher than the level below 12% from a week earlier. Even more noteworthy is the market’s more aggressive pricing for the September meeting: the probability of holding rates unchanged is only 18.6%, the probability of cumulative 25 bps rate hikes is 56%, and the probability of cumulative 50 bps rate hikes is 25.4%.
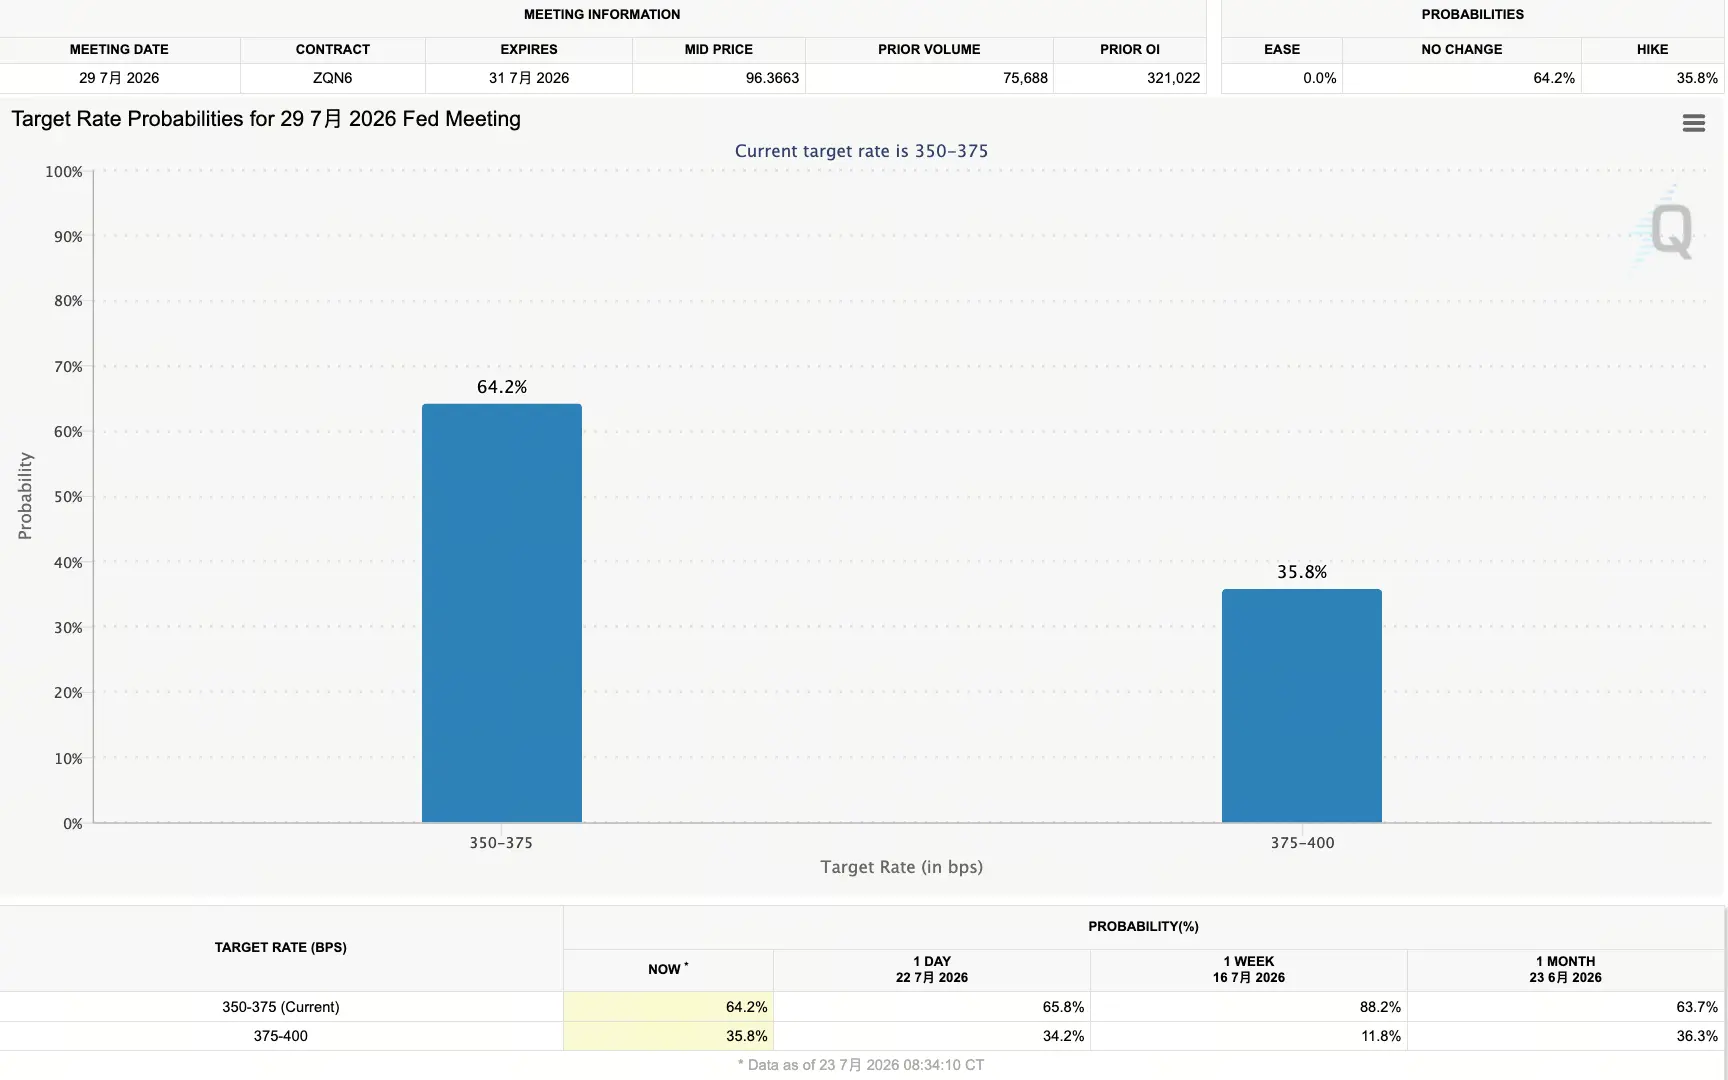
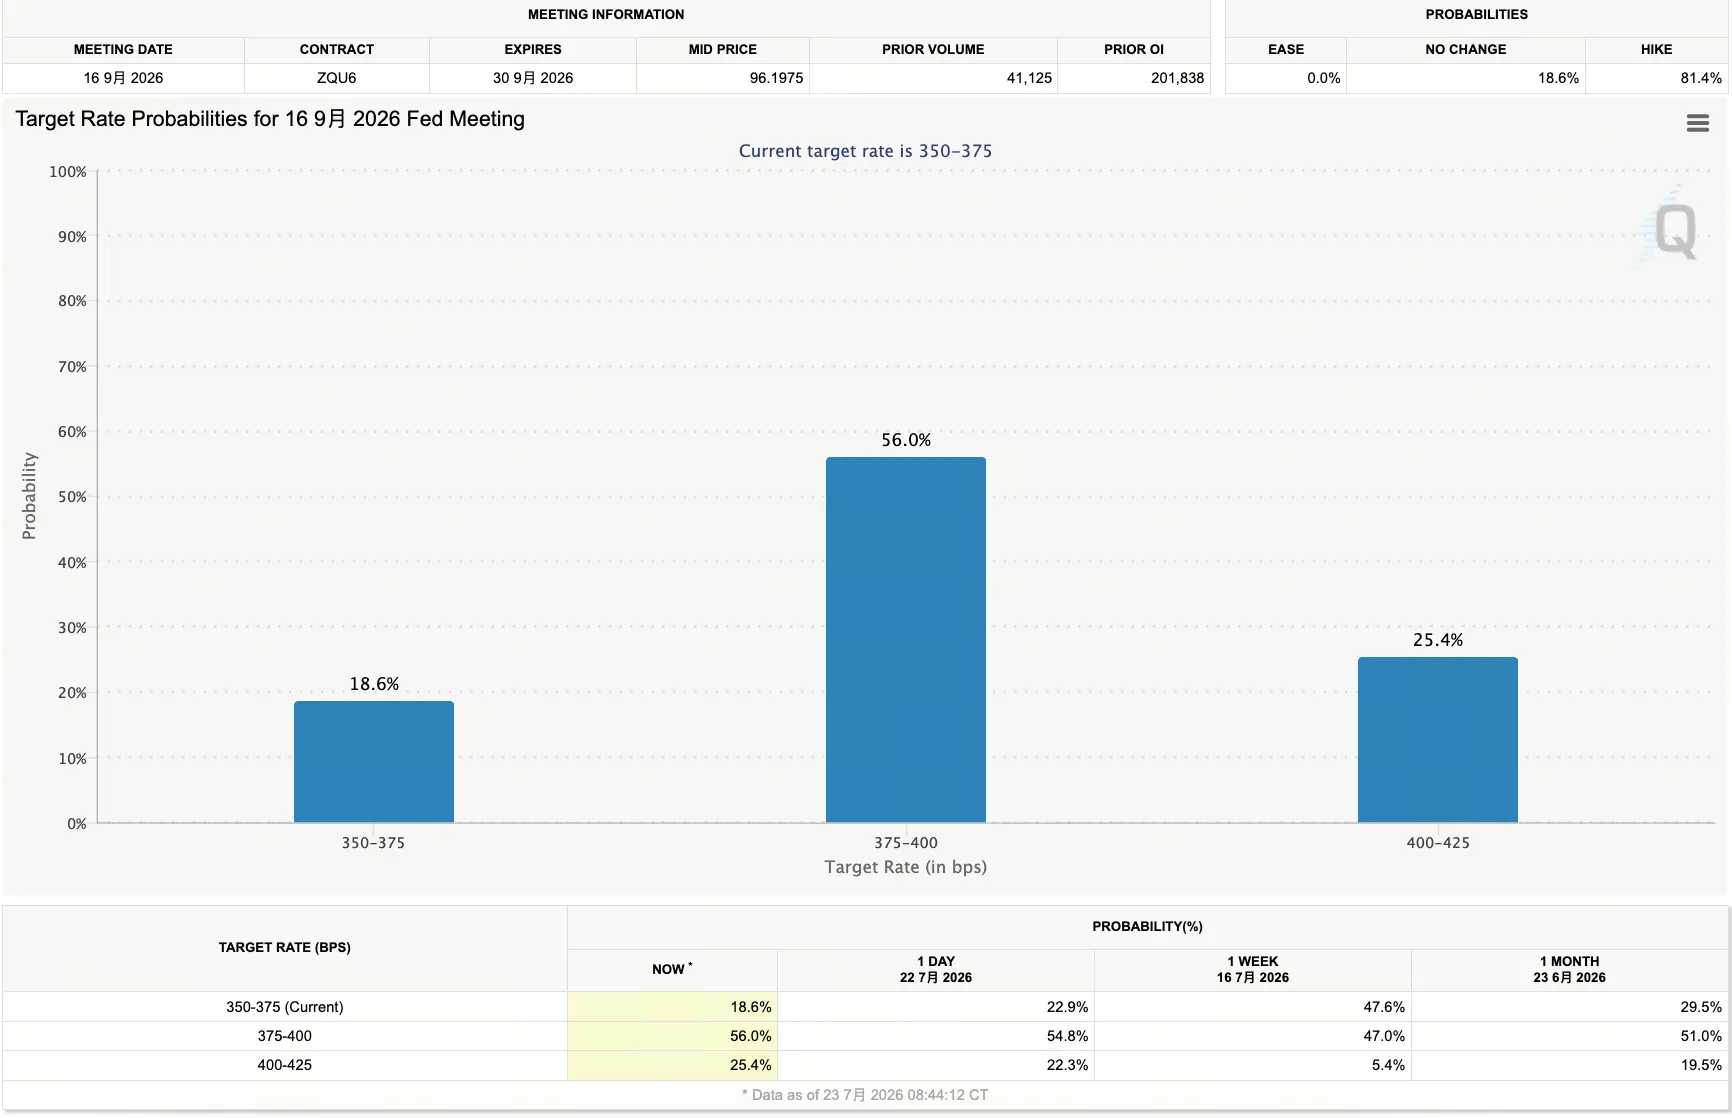
This means the market has essentially ruled out the possibility of a rate cut in the near term and is repricing a higher-for-longer rate regime. What is driving this shift?
Oil prices back above $100: the relight of inflation expectations
Energy prices are the most penetrating variable in the inflation transmission chain. With Brent crude returning to $100, its impact goes far beyond the price tags at gas stations.
In the transmission chain, rising crude oil prices directly lift transportation costs; higher transportation costs raise companies’ production costs; and ultimately this translates into upward pressure on terminal product prices. With global supply chains still in a fragile balance, the efficiency of this transmission chain may be higher than historical averages.
The immediate trigger for this surge in oil prices is the renewed escalation of geopolitical conflict. In the early hours of July 23, Yemen’s Houthi forces announced that they attacked two Saudi oil tankers that violated its blockade orders using missiles and drones in the Red Sea. At the same time, the US issued threats to escalate its strike operations against Iran and is deploying more forces to the Middle East. Tensions on the Red Sea shipping route directly threaten the safety of global energy transportation channels, and market concerns about further tightening of crude supply quickly intensified.
Capital Economics climate and commodities economist Hamad Hussain said, “Unless there are clear signs that conflicts around the world are de-escalating, the upside risk for oil prices remains tilted.”
Oil price gains directly affect inflation expectations. After the Iran-US ceasefire agreement in June, oil prices once fell and inflation data cooled. But the fragile peace quickly unraveled, and Brent crude rebounded sharply from the lows. Data from the American Automobile Association (AAA) shows that this week the U.S. retail gasoline price average has reached $4 per gallon, the highest level in more than a month.
For the Fed, inflation driven by energy prices versus inflation driven by demand has different policy implications. The former is more of a supply-side shock, with limited direct effects from monetary policy. The problem is that if energy prices keep rising for long enough, they may turn into broader pricing pressure through the inflation-expectations channel—exactly the scenario the Fed least wants.
4.7% Treasury yields: a recalibration of the global asset pricing anchor
When the yield on the 10-year US Treasury breaks above 4.7%, its market implications go far beyond volatility in the bond market.
10-year Treasury yields are often called the “anchor for global asset pricing.” Changes in yields feed into valuation logic for all risk assets through the discount-rate effect. When the risk-free rate rises, the present value of future cash flows falls, putting direct valuation pressure on asset classes with longer duration—especially technology and growth stocks.
On July 23, this pressure was fully reflected in the US stock market. The Dow Jones Industrial Average fell 0.97% to 51,711.65, the S&P 500 dropped 1.21% to 7,408.30, and the Nasdaq Composite fell 2.15% to 25,137.69. The Nasdaq 7 Majors Index fell 4.8%, and market capitalization evaporated by $797B in a single day. Tesla plunged more than 14%, and Google dropped more than 7%.
A rise in 10-year Treasury yields also directly transmits to real-economy borrowing costs. The average interest rate on US 30-year fixed-rate mortgages has already risen to 6.58% this week, the highest level in nearly a year. If borrowing costs keep rising, they will suppress consumption and investment.
What deserves attention is the stickiness of long-end yields. The 30-year Treasury yield has risen to 5.19%, and the period of trading above 5% has already exceeded any stretch since 2007. Unlike the surge in yields in 2023 and earlier periods, after this long-end yield touched 5%, it did not quickly retreat. Alexander Payne, head of mortgage and volatility at Vanguard, said that this selloff had no single “spark,” but the market also showed no signs of a swift “buy the dip.”
Dustin Reid, chief fixed income strategist at Mackenzie Investments, noted that for long-duration bonds, “the biggest enemy” is inflation. If investors think inflation will remain high for the long run, they will demand a higher term premium as compensation—this is exactly the story unfolding in the current Treasury market.
DXY rises above 101: a signal of tightening global liquidity
The DXY closed at 101.445. Although this is not an all-time extreme level, the underlying driving logic deserves attention.
The immediate driver of the dollar’s strength is the rise in Treasury yields. When risk-free rates increase, the appeal of dollar assets strengthens, and capital returning to dollar assets becomes a rational choice. The DXY rose 0.32%; EUR/USD fell to 1.1377; and GBP/USD dropped to 1.3318.
The impact of a stronger dollar on global liquidity mainly transmits through two channels.
First is capital outflow pressure from emerging markets. A rising dollar means higher costs for emerging market countries to repay USD-denominated debt, while capital tends to flow back from high-risk markets to dollar assets. Such capital flows can trigger chain reactions in some economically fragile economies.
Second is the suppressive effect on USD-denominated commodity prices. While current oil prices remain strong due to geopolitical factors, a strengthening dollar typically exerts marginal pressure on commodity prices, which to some extent acts as a hedge against inflation pressure.
For the crypto market, the DXY trend has special significance. Although some investors view crypto assets such as Bitcoin as a hedge against fiat currency depreciation, in short-term price action they often show a negative correlation with the DXY. When the dollar strengthens and global liquidity tightens, the valuation of risk assets usually comes under pressure.
The Fed’s July meeting: why the rate-hike probability rose from under 12% to nearly 35%
A week ago, the market believed the probability of a Fed rate hike in July was still below 12%. By July 24, that probability had risen to 35.8%. The logic behind this change can be understood on three levels.
First, inflation risks have resurfaced. US CPI data for June came in weak, once pushing the probability of a July Fed rate hike down to near 10%. But oil prices returning to $100 changed this narrative. Rising energy prices not only directly affect the energy component of CPI, but may also transmit to broader price levels through transportation costs and companies’ production costs. The PCE inflation data the Fed focuses on also faces upward pressure from energy prices.
Second, there is still no fundamental reason for rate cuts. In the week of July 18, initial jobless claims in the US fell to 187k, well below the 212k forecast by economists surveyed by the WSJ, and the lowest level since 1969. Atlanta Fed’s GDPNow tracking indicator shows that the growth rate of real final domestic demand is expected to be close to 3%. A strong labor market and steady growth provide grounds for the Fed to prioritize addressing inflation.
Third, financial conditions remain too loose. Although Treasury yields have risen, US stocks had remained strong earlier, and credit conditions overall have stayed loose. Fed officials may worry that if they signal rate cuts too early, financial conditions will ease further—amplifying the risk of an inflation rebound. Michael Ball, a macro strategist, noted that given inflation is still high, the fundamentals are solid, and the number of FOMC decision votes supporting rate hikes is increasing, the market may still be underestimating the likelihood of a Fed rate hike at the July meeting.
FWDBONDS chief economist Christopher Rupkey said that already half of the Fed officials have put rate hikes for this year on the table. However, structural risks in the jobs market—especially rising difficulty for new graduates in finding work—remain a potential pitfall that policymakers have to weigh.
The market’s pricing for the interest-rate path has undergone a systematic change. From futures market pricing, the market not only expects a rate hike in July, but also believes a September rate hike is nearly a sure thing—the probability of holding rates unchanged in September is only 17.6%. This means the market is increasingly accepting a longer period of high interest rates.
What it means for the crypto market
Short-term pressure
According to Gate’s market data, Bitcoin was quoted at $65,098.2 on July 24, down 1.09% over the past 24 hours, up 3.73% over the past 7 days, but down 44.85% over the past year. Ethereum was $1,873.99, down 2.84% over the past 24 hours, up 5.49% over the past 7 days, but down 50.10% over the past year.
The triple macro pressures mainly affect crypto assets in the short term through the following channels.
Tightening dollar liquidity is the most direct transmission mechanism. When Treasury yields rise and the dollar strengthens, the global liquidity environment tends to tighten, and inflows into risk assets decrease. Bitcoin, as a high-risk asset, often faces valuation pressure in this environment.
A decline in risk appetite is also important. Worries about inflation triggered by rising oil prices, uncertainty from escalating geopolitical conflicts, and rising expectations of rate hikes all jointly suppress market risk appetite. Investors tend to reduce allocations to high-risk assets and increase holdings of cash or low-risk assets. When Bitcoin fell below the $65,000 level, it reflected this market logic.
Pressure on altcoins is even more pronounced. When liquidity is sensitive, market caps are lower, and investors’ risk appetite declines, capital outflows typically accelerate—making altcoins more volatile than Bitcoin in macro headwinds.
Medium- to long-term variables
If the market moves into a phase of “high inflation + high interest rates + fiscal pressure,” the pricing logic for crypto assets may need to be reassessed.
On one hand, a high-rate environment means the opportunity cost of holding non-yielding assets rises, which structurally suppresses assets that do not generate cash flows such as Bitcoin. On the other hand, if concerns about fiat credit and fiscal sustainability increase, the narrative of Bitcoin as “digital gold” may regain attention—just as some investors in 2020–2021 viewed Bitcoin as an inflation-hedging tool.
Worth noting is gold’s recent performance. Against the backdrop of surging oil prices and rising geopolitical risk, COMEX gold futures actually fell 2% to $4,052.3 per ounce. A dollar rebound, rising real yields, and increasing expectations of Fed rate hikes outweighed support for gold from traditional safe-haven demand. This phenomenon shows that even traditional safe-haven assets are not immune to a stronger dollar and rising rates in the current macro environment. With higher volatility, Bitcoin faces even more complex challenges.
Deepening cross-market linkages
The current market environment is driving further integration between traditional financial markets and the digital-asset market. What investors are watching is no longer a single market, but multi-asset linkages that include oil, gold, US stocks, US Treasuries, the dollar, and crypto assets.
Gate TradFi has covered multiple asset classes, including gold CFD, silver CFD, stock trading, and crypto assets. Changes in the macro cycle are tightening the relationship of capital rotation among different asset categories. For investors, understanding how macro variables transmit across markets has become an indispensable part of asset allocation.
Conclusion
Oil prices returning to $100, the 10-year US Treasury yield breaking above 4.7%, and the DXY rising above 101—these three layers of pressure are reshaping market expectations for the Fed’s policy path. The probability of a Fed rate hike in July rose from under 12% a week earlier to 35.8%, and the probability of a rate hike in September has already exceeded 80%. The market is shifting from a “rate-cut narrative” to “pricing a higher-for-longer” interest-rate cycle.
For the crypto market, the near term faces a double hit: tighter dollar liquidity and declining risk appetite. Bitcoin’s range-bound action near $65,000, Ethereum’s lackluster performance, and capital outflows from altcoins are direct reflections of this macro environment. But over the medium to long term, if market concerns about inflation persistence and fiscal sustainability deepen further, the narrative of Bitcoin as an alternative store of value may regain attention.
The evolution of the macro cycle is never linear. The direction of geopolitical conflicts, the persistence of oil prices, the resilience of the labor market, and statements from Fed officials will all influence market pricing logic in the coming weeks. For investors, understanding capital rotation relationships across different asset categories may matter more than betting on the direction of a single market.
FAQ
Q1: What is the current probability of a Fed rate hike in July?
Based on CME FedWatch tool data on July 24, the probability that the Fed will hold rates steady at the July meeting is 64.2%, and the probability of cumulative 25 bps of rate hikes is 35.8%. A week ago, the rate-hike probability was under 12%, implying a significant change in the near term.
Q2: Why does a rise in oil prices affect the Fed’s rate-hike decision?
Rising crude oil prices increase transportation costs and companies’ production costs, which ultimately feed into terminal goods prices. Higher energy prices not only directly affect CPI, but may also trigger broader price pressure through the inflation-expectations channel. When inflation risks re-emerge, the need for the Fed to maintain high rates—and potentially hike further—increases accordingly.
Q3: What does a break above 4.7% in the 10-year US Treasury yield mean for the market?
The 10-year US Treasury yield is an important reference benchmark for global asset pricing. A higher yield means a higher risk-free return, which—via the discount-rate effect—lowers valuation multiples for risk assets such as stocks, especially technology and growth stocks. At the same time, it can also raise corporate financing costs and household mortgage costs.
Q4: How does a stronger DXY affect the crypto market?
A stronger dollar typically implies tighter global liquidity and a tendency for capital to return to dollar assets. This leads to risk assets facing pressure from capital outflows, and crypto assets such as Bitcoin and Ethereum often face downside pressure on prices in the short term. Bitcoin falling below $65,000 reflects this macro logic.
Q5: Is Bitcoin a safe-haven asset in the current macro environment?
Bitcoin’s safe-haven characteristics differ between the short term and the medium term. In the short term, it is still treated as a risk asset and is heavily influenced by dollar liquidity and risk appetite. But over the medium to long term, if concerns about fiat credit and fiscal sustainability rise, the narrative of Bitcoin as “digital gold” may regain attention. Gold’s recent decline suggests that even traditional safe-haven assets have not been immune to a stronger dollar and rising interest rates.