At 20:30 Beijing time tonight, the U.S. Bureau of Labor Statistics will release the June non-farm payrolls report. This is the first non-farm report since Fed Chairman Walsh took office—the Fed is shifting from a "forward guidance" framework to a "data-driven + rebuilding credibility" model.

The market generally expects June non-farm payrolls to increase by 110,000 to 114,000, down from 172,000 in May; the unemployment rate is expected to remain at 4.3% for the fourth consecutive month; average hourly earnings are expected to rise 0.3% month-over-month and 3.5% year-over-year. These numbers, while seemingly moderate, conceal a much more complex game beneath the surface. CME FedWatch shows the probability of a July hike is around 28.3%, and the probability of a cumulative 25 basis point hike by September is 49.8%. But if employment unexpectedly weakens, this expectation could quickly reverse.
The real significance of tonight's non-farm data is not to judge the strength of the U.S. economy, but to determine whether the Fed's "tolerance boundary" for employment and inflation has shifted.
Divergence: Dispersion of forecasts within the 110,000 consensus
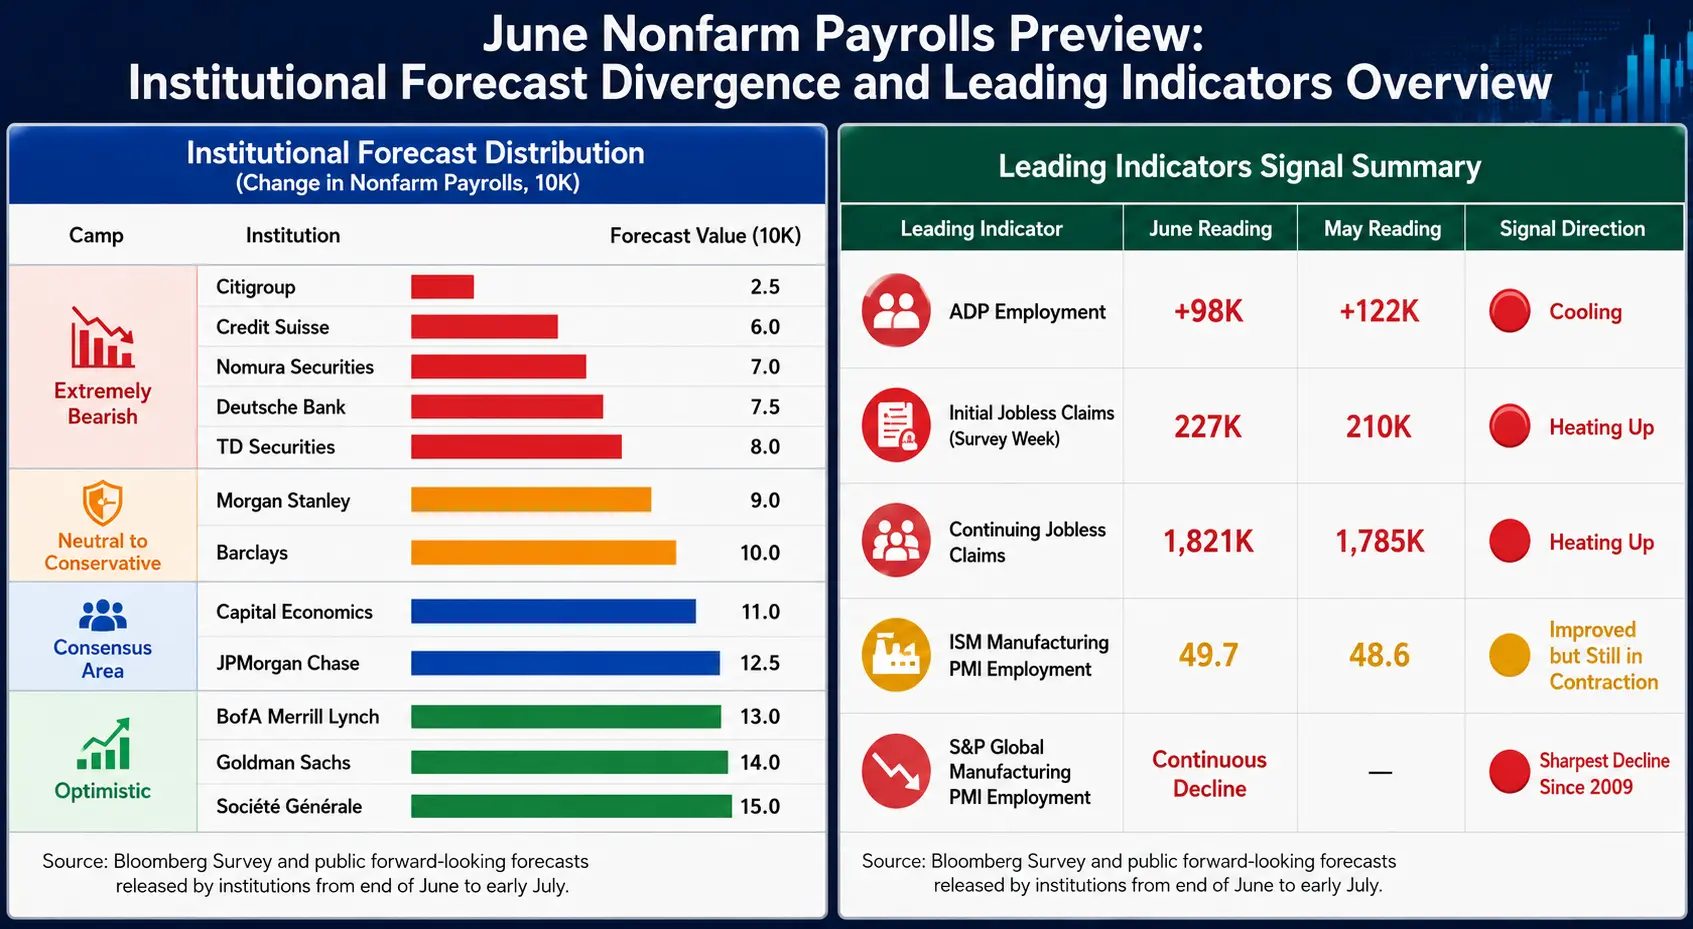
The market consensus is 110,000, but institutional forecasts are unusually spread across nearly an 8-fold range—from Citigroup's 25,000 to Societe Generale's 150,000.
Bearish end (below 80,000): Citigroup (25,000), Nomura (70,000), Deutsche Bank (75,000), TD Securities (80,000)
Neutral end (80,000 to 120,000): Morgan Stanley (90,000), Barclays (100,000), Capital Economics (110,000), JPMorgan (125,000)
Bullish end (above 130,000): Bank of America Merrill Lynch (130,000), Goldman Sachs (140,000), Societe Generale (150,000)
This extreme divergence itself is a signal: the market lacks consensus on the true state of the labor market.
Goldman Sachs economists Ronnie Walker and Jessica Linders point out that the World Cup may "contribute" around 40,000 temporary jobs to June non-farm payrolls, concentrated in leisure and hospitality, professional and business services, etc., thus raising their forecast to 140,000. Excluding this "artificial boost," the real labor market could be weaker than the headline number suggests.
Another historical pattern worth noting: In 11 of the past 13 years, the initial June reading was eventually revised downward, and in each of the past four years, it was revised lower in subsequent corrections. No matter what tonight's data shows, the final version may deviate significantly from the initial print.
June non-farm preview: Institutional forecast divergence and leading indicator panorama
Leading indicators: All pointing to a slowdown
Multiple data points have already released cooling signals ahead of the non-farm report, but their directional guidance has subtle differences:
ADP employment (98,000): Below expectations (118,000) and the previous month (122,000), the lowest since March. Nearly half the increase is concentrated in a single sector—education and health services—making industry concentration a medium-term concern.
Initial jobless claims: Recorded 227,000 during the survey week, higher than the 210,000 in the May survey period; continuing claims rose from 1.785 million to 1.821 million. Pantheon Macroeconomics notes that both have been trending upward since early May, consistent with the judgment that non-farm payrolls are slowing to below breakeven levels.
ISM Manufacturing PMI employment subindex: Rose from 48.6 to 49.7, approaching the 50 breakeven line, indicating a narrowing contraction in manufacturing employment. However, S&P Global's Manufacturing PMI employment subindex declined for the second consecutive month, with the pace of job cuts being the fastest since the 2020 pandemic, and excluding pandemic effects, the fastest since 2009.
Consumer confidence: The proportion of respondents saying "jobs are hard to get" rose to 22.5%, the highest since January 2021; the labor market differential ("jobs plentiful" minus "jobs hard to get") fell 2.6 percentage points to 2.4.
Overall, leading indicators point to slowing employment growth, but the degree of slowing is disputed—this is the fundamental reason for the extremely wide forecast range.
Three key variables: Wages, employment, and unemployment rate
First weight: Wage data
Among all data tonight, wage data is more important than the headline employment number. The market expects average hourly earnings to rise 0.3% month-over-month and 3.5% year-over-year. If the monthly figure exceeds 0.3% or the annual figure re-accelerates, it will directly reinforce the narrative of inflation pressure and push up rate hike expectations; conversely, it provides doves with a reason to wait. With current retail gasoline prices falling and inflation expectations declining, a window has opened for doves to buy time.
Second weight: Employment number
110,000 is an "anchor," but the market truly cares about the direction and magnitude of any deviation. In the first five months of this year, non-farm payrolls averaged about 101,000 per month, with four months exceeding expectations. The threshold for triggering substantive discussion of a July hike is: an unemployment rate of 4.2% combined with employment gains above 150,000, or an unemployment rate of 4.3% combined with employment gains above 175,000. Below this threshold, talk of a July hike will quickly cool.
Third weight: Unemployment rate
4.3% is expected to remain unchanged for the fourth consecutive month. The key is whether this is a stable plateau or an inflection point to the upside—once the unemployment rate begins to rise, the market will shift from "soft landing trades" to "recession pricing." The June FOMC dot plot lowered the year-end unemployment rate forecast from 4.4% to 4.3%.
The labor force participation rate is a hidden variable for judging data authenticity: a rising participation rate will passively push up the unemployment rate, while a falling participation rate may "beautify" the headline number.
Three layers of mismatch: What the market is calibrating
The real role of non-farm data is to simultaneously calibrate the following three structural deviations:
Economic reality layer: Is employment truly cooling? Are wages substantially slowing? How much real signal is masked by the World Cup? ADP hit a new low, jobless claims are rising, manufacturing layoffs are accelerating, but the ISM Manufacturing PMI has been expanding for six consecutive months—reality itself is contradictory.
Fed narrative layer: Walsh described the labor market as "solid and even improving" in his first press conference on June 17, and recently said the risk of inflation has declined. His style differs from his predecessor—he will not "drop breadcrumbs" of guidance at forums. Bank of America Securities notes that since mid-2023, the real policy rate has eased by over 100 basis points, while the net change in the unemployment rate is nearly zero, providing a basis to reverse last year's 75 basis points of rate cuts.
Market pricing layer: July hike probability at 28.3%, September at 63.9%, and over a longer horizon approaching 85%. The bizarre coexistence of both rate cut and rate hike expectations precisely illustrates the market's lack of clear consensus on the Fed's path.
Asset transmission: Logic chain from data to prices
U.S. Dollar Index closed at 101.39 on July 2, with moving averages showing a bullish alignment (20-day MA 100.63, 50-day MA 99.53), forming a strong support zone. Strong data could push the dollar toward 102.00; weak data would bring short-term pressure but not break the medium-term bullish structure.
U.S. Treasury yields: 2-year at 4.183%, 10-year at 4.458%, with a spread of about 30 basis points. The bond market is the first-responder market after non-farm data—the 2-year reflects repricing of rate expectations, while the 10-year reflects changes in growth and inflation expectations.
U.S. stocks on July 2 (Beijing time): Nasdaq fell 0.66% to 26,040.03, S&P 500 fell 0.22% to 7,483.23, and the Philadelphia Semiconductor Index plunged 6.27%. If non-farm data is strong, tech stocks face dual pressure from rising discount rates and tightening liquidity.
Bitcoin traded in the $60,000 to $60,500 range on July 2, up about 2.3% in 24 hours. Walsh's earlier comments that inflation risks have eased provided a clear boost to the market. Bitcoin's transmission logic from non-farm data: non-farm up → real rates up → Bitcoin down; non-farm down → rate cut expectations up → risk assets reprice.
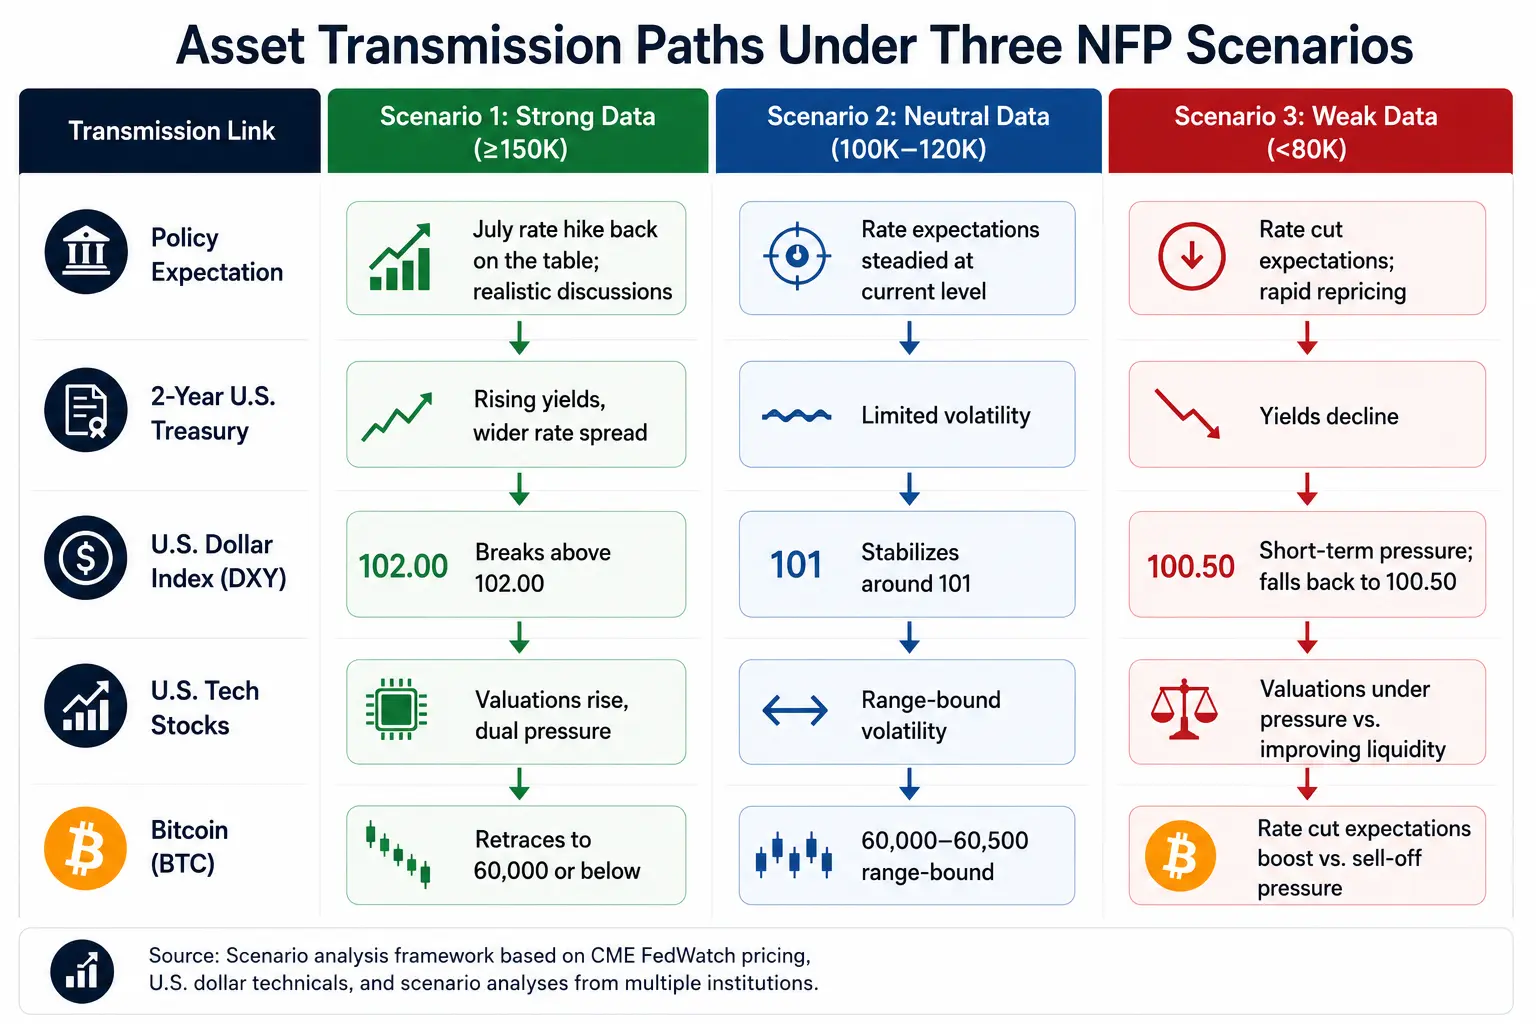
Asset transmission paths under three non-farm scenarios
Key observation checklist for tonight
Expectation anchor: The key is not 110,000 itself, but whether the market's shadow expectations have already priced in a "cooling" scenario in advance. If already fully priced, weak data may not cause a decline and could even lead to a rally.
Wage data: The highest-weighted variable. Whether the monthly figure exceeds 0.3% and whether the annual figure re-accelerates is more critical than the headline employment number itself.
Unemployment rate nature: Whether 4.3% is a stable plateau or an inflection point to the upside will determine when the market shifts from "soft landing" to "recession pricing."
Previous data revisions: Any significant revision to the May data will alter the 3-month average trend and often has more directional impact than the current month's data.
Bond market first reaction: Prioritize observing the 2-year (rate expectations) and 10-year (growth and inflation); stocks are the second-responder market.
USD/JPY: Hovering around 162.00, a key indicator for carry trade risk and global liquidity marginal signals.
FAQ
Q1: What is the market expectation for June non-farm payrolls?
The market generally expects June non-farm payrolls to increase by 110,000 to 114,000, lower than May's 172,000; the unemployment rate is expected to remain at 4.3%; average hourly earnings are expected to rise 0.3% month-over-month and 3.5% year-over-year. Institutional forecasts vary widely—Bloomberg's survey shows a high of 200,000 and a low of just 25,000.
Q2: How will non-farm data affect the Fed's July rate decision?
The threshold for triggering substantive discussion of a July hike is: an unemployment rate of 4.2% combined with employment gains above 150,000, or an unemployment rate of 4.3% combined with employment gains above 175,000. Below this threshold, talk of a hike will quickly cool. CME FedWatch shows the current probability of a July hike is around 28.3%.
Q3: How does the World Cup affect June non-farm data?
Goldman Sachs estimates the World Cup may "contribute" around 40,000 temporary jobs to June non-farm payrolls, mainly in leisure and hospitality, professional and business services, etc., thus raising its forecast to 140,000. Excluding the event effect, the real labor market could be weaker than the headline number suggests.
Q4: How does non-farm data affect Bitcoin prices?
Transmission logic: Strong employment → real rates rise → Bitcoin pressured; weak employment → rate cut expectations rise → risk assets reprice. Bitcoin traded in the $60,000 to $60,500 range on July 2.